A Technical Guide on How to Scale Microservices
 By opsmoon
Learn how to scale microservices using actionable strategies for autoscaling, service mesh, and observability to build resilient, high-performance systems.
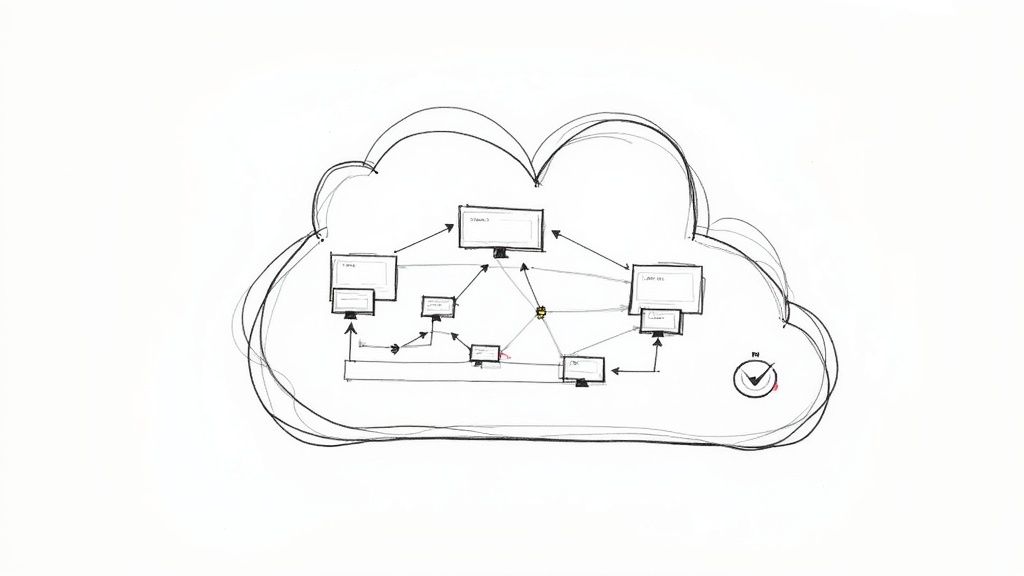
To scale microservices effectively, you must build on a solid architectural foundation. This isn't about reactively throwing more servers at a problem; it's about proactively designing for elasticity with stateless services and asynchronous communication. Nailing these core principles transforms a rigid, fragile system into one that can dynamically adapt to load.
Building a Foundation for Scalable Microservices
Before configuring autoscaling rules or deploying a service mesh, you must scrutinize your system's core design. Bypassing this step means any attempt to scale will only amplify existing architectural flaws, forcing you into a reactive cycle of firefighting instead of building a resilient, predictable system.
A truly scalable architecture is one where adding capacity is a deterministic, automated task, not a high-stakes manual intervention. The primary objective is to create an environment where services are loosely coupled and operate independently, allowing you to scale one component without triggering cascading failures across the entire system.
Designing for Statelessness
A stateless service is the cornerstone of a horizontally scalable system. The principle is straightforward: the service instance does not store any client session data between requests. Each incoming request is treated as an atomic, independent transaction, containing all the necessary context for its own processing.
This architectural pattern is a game-changer for elasticity. Because no instance holds unique state, you can:
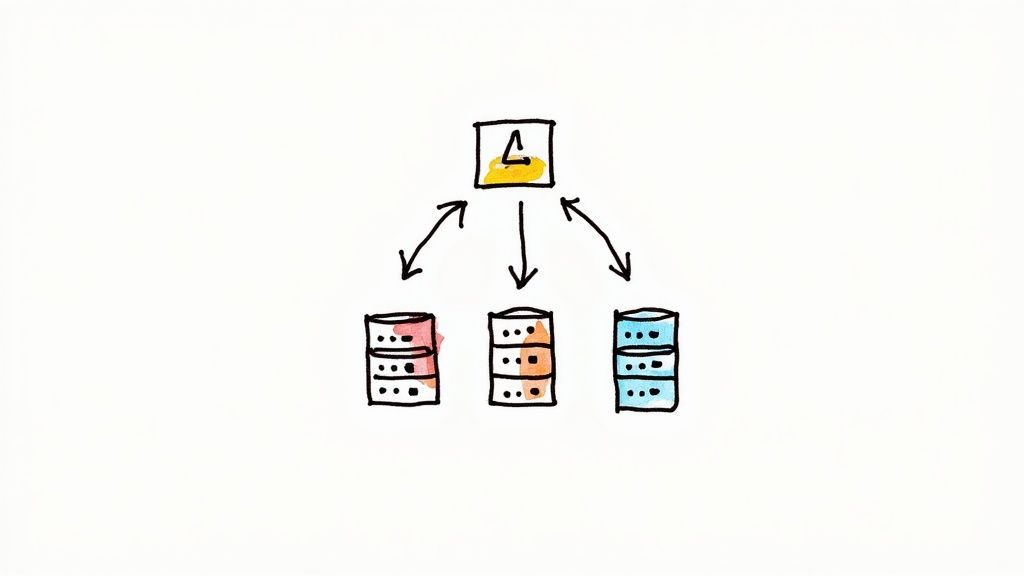
- Programmatically add or remove instances based on real-time metrics.
- Distribute traffic across all available instances using simple load-balancing algorithms like round-robin.
- Achieve high availability, as another instance can immediately process the next request if one fails. No session data is lost.
Of course, applications require state, such as user session details or shopping cart contents. The solution is to externalize this state to a dedicated, high-throughput data store like Redis or Memcached. This creates a clean separation of concerns: your application logic (the microservice) is decoupled from the state it operates on, allowing you to scale each layer independently.
The core benefit of statelessness is treating your service instances as ephemeral and completely disposable. When you can terminate and replace an instance at any moment without user impact, you have achieved true cloud-native elasticity.
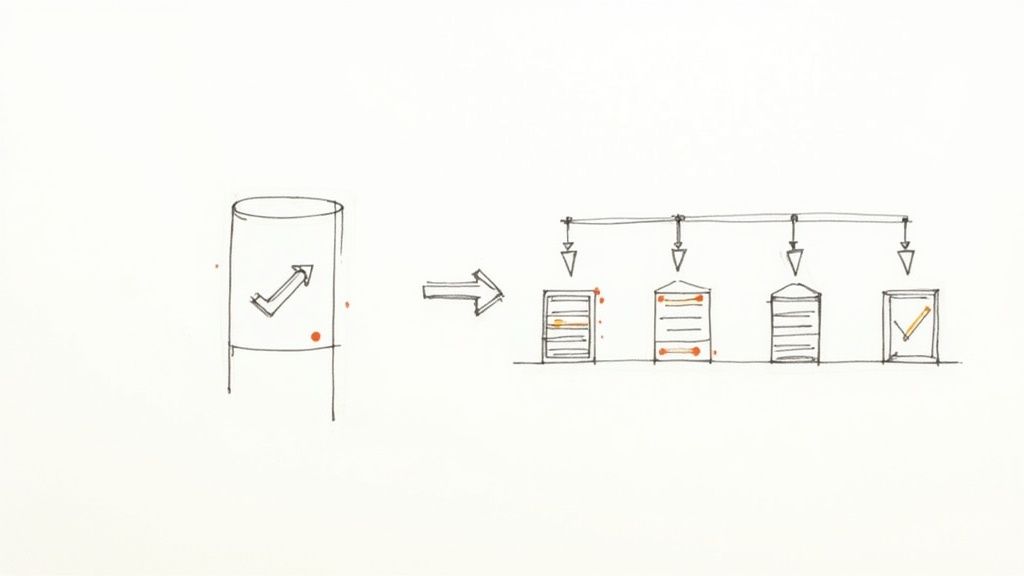
This is the key enabler for horizontal scaling, which is fundamentally superior to vertical scaling for modern distributed systems.
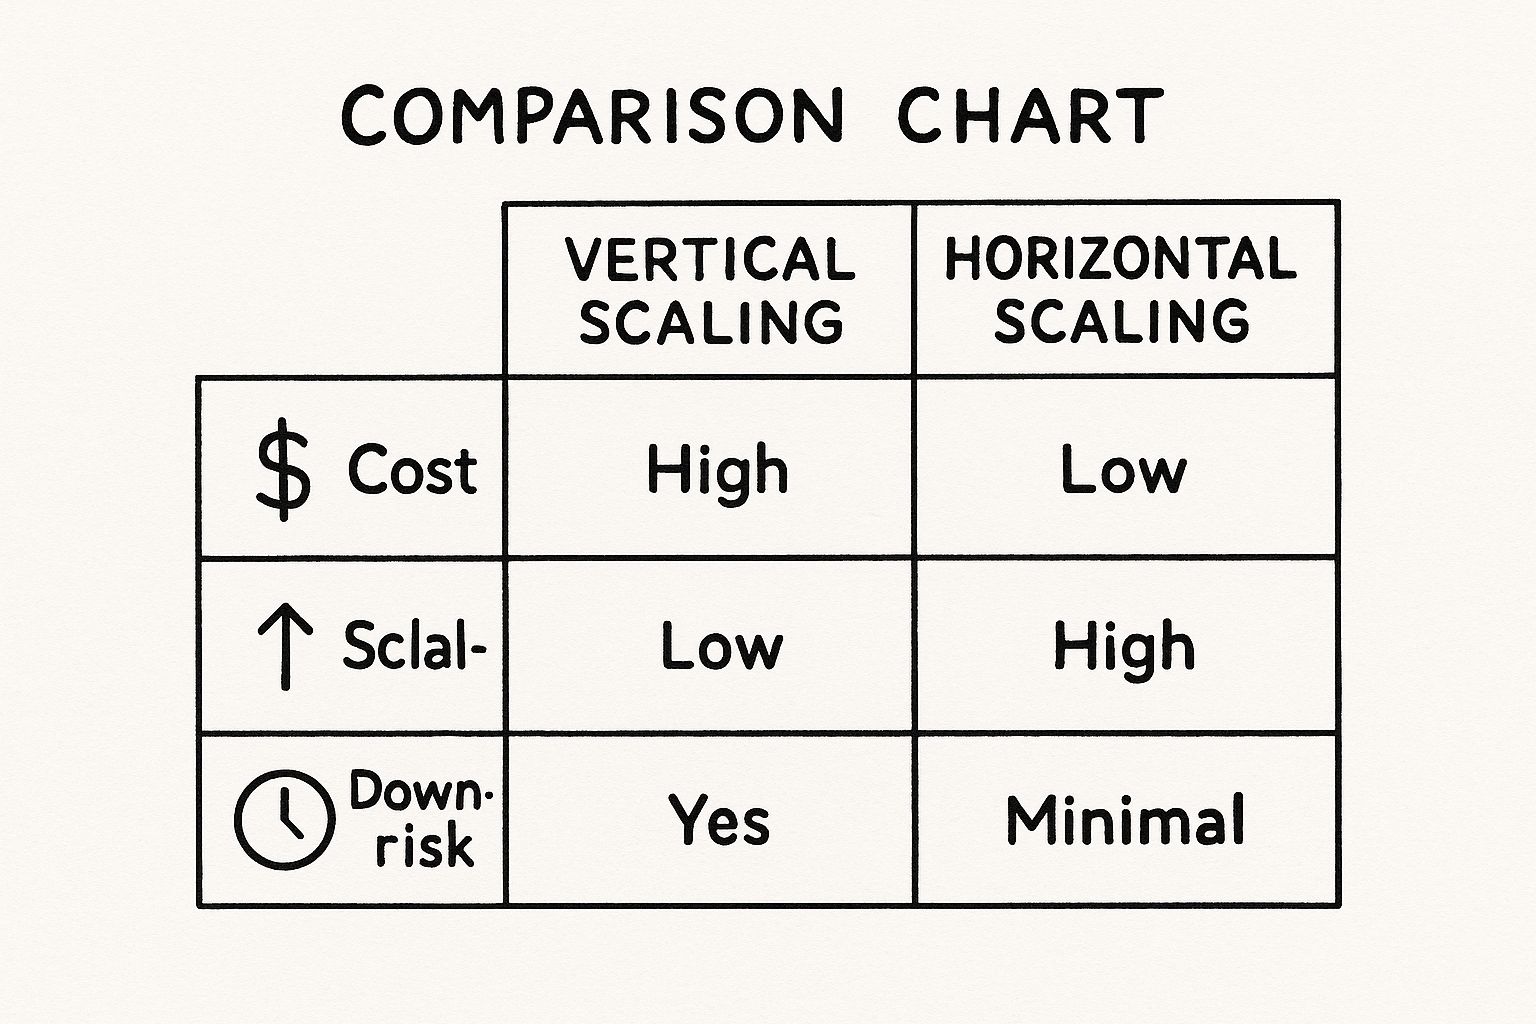
As the diagram illustrates, horizontal scaling—unlocked by stateless design—is the definitive strategy for building cost-effective, fault-tolerant systems designed for high-concurrency workloads.
Decoupling with Asynchronous Communication
The second foundational pillar is the communication pattern between services. Tightly coupled, synchronous request/response calls (e.g., Service A makes a REST call to Service B and blocks until it gets a response) create a brittle chain of dependencies. If the Payment service experiences high latency, the Order service is left waiting, consuming resources and risking a timeout. This is a classic recipe for cascading failures.
Asynchronous communication, implemented via a message broker like Kafka or RabbitMQ, severs this direct dependency.
Instead of a blocking call, the Order service publishes a PaymentRequested event to a message queue. The Payment service, as a consumer, processes messages from that queue at its own pace. This creates a temporal decoupling and acts as a buffer, absorbing traffic spikes and allowing services to operate independently. For a deeper technical dive into these concepts, explore various https://opsmoon.com/blog/microservices-architecture-design-patterns.
This architectural shift is a major industry trend. The microservices orchestration market was valued at USD 4.7 billion in 2024 and is projected to reach USD 72.3 billion by 2037, growing at a 23.4% CAGR. This reflects a global move towards building distributed systems designed for resilience and scale.
Finally, a scalable architecture demands a clean codebase. It's critical to implement strategies to reduce technical debt, as unmanaged complexity will inevitably impede your ability to scale, regardless of the underlying infrastructure.
Implementing Effective Autoscaling Strategies
Effective autoscaling is not merely about increasing instance counts when CPU utilization exceeds a threshold. That is a reactive, lagging indicator of load. A truly effective scaling strategy is intelligent and proactive, responding to metrics that directly reflect business activity and service health.
This requires configuring your system to scale based on application-specific metrics. For a video transcoding service, the key metric might be the number of jobs in a RabbitMQ queue. For a real-time bidding API, it could be p99 latency. The objective is to align resource allocation directly with the workload, ensuring you scale precisely when needed.
Moving Beyond Basic CPU Metrics
Relying solely on CPU-based scaling is a common but flawed approach. A service can be completely saturated with requests while its CPU utilization remains low if it is I/O-bound, waiting on a database or a downstream API call. To scale effectively, you must leverage custom, application-aware metrics.
Here are several more effective scaling triggers:
- Queue Length: For services that process tasks from a message queue like RabbitMQ or AWS SQS, the number of messages awaiting processing is a direct measure of backlog. When SQS's
ApproximateNumberOfMessagesVisiblemetric surpasses a defined threshold, it is an unambiguous signal to scale out consumer instances. - Request Latency: Scaling based on p99 latency directly protects the user experience. For example, if the 99th percentile response time for a critical
/api/v1/checkoutendpoint exceeds a 500ms Service Level Objective (SLO), an autoscaling event can be triggered to add capacity and reduce latency. - Active Connections: For services managing stateful connections, such as a WebSocket-based chat service, the number of active connections per instance is a direct and accurate measure of load.
Using these application-specific metrics enables more intelligent and responsive scaling decisions that are directly tied to user-perceived performance.
Configuring the Kubernetes Horizontal Pod Autoscaler
The Kubernetes Horizontal Pod Autoscaler (HPA) is the primary tool for implementing these strategies. A naive configuration using only minReplicas and maxReplicas is insufficient. Strategic configuration is what distinguishes a fragile system from a resilient one.
Consider this practical HPA manifest for a service processing messages from a custom queue, exposed via a Prometheus metric:
apiVersion: autoscaling/v2
kind: HorizontalPodAutoscaler
metadata:
  name: message-processor-hpa
spec:
  scaleTargetRef:
    apiVersion: apps/v1
    kind: Deployment
    name: message-processor
  minReplicas: 3
  maxReplicas: 20
  metrics:
  - type: Pods
    pods:
      metric:
        name: queue_messages_per_pod
      target:
        type: AverageValue
        averageValue: "10"
In this configuration, the HPA targets an average of 10 messages per pod. If the total queue length jumps to 100, the HPA will scale the deployment up to 10 pods to process the backlog efficiently. This is far more responsive than waiting for CPU utilization to increase. For a more detailed walkthrough, consult our guide on autoscaling in Kubernetes.
Pro Tip: Set
minReplicasto handle baseline traffic to ensure availability. ThemaxReplicasvalue should be a hard ceiling determined not just by budget, but also by the capacity of downstream dependencies like your database connection pool.
Preventing Thrashing and Getting Proactive
A common autoscaling anti-pattern is "thrashing," where the autoscaler rapidly scales pods up and down in response to oscillating metrics. This is inefficient and can destabilize the system. To prevent this, configure cooldown periods, or stabilization windows.
The Kubernetes HPA includes configurable scaling behaviors. For instance, you can define a scaleDown stabilization window of 5 minutes (stabilizationWindowSeconds: 300). This instructs the HPA to wait five minutes after a scale-down event before considering another, preventing overreactions to transient dips in load.
For predictable traffic patterns, such as a holiday sales event, reactive scaling is insufficient. This is where predictive scaling becomes valuable. Tools like AWS Auto Scaling can use machine learning models trained on historical data to forecast future demand and provision capacity before the traffic surge occurs. This shifts the system from being merely reactive to truly proactive, ensuring resources are ready the moment users need them.
Mastering Service Discovery and Load Balancing
As you scale out, service instances become ephemeral, with IP addresses changing constantly. Hardcoding network locations is therefore impossible. This is the problem that service discovery solves, acting as a dynamic, real-time registry for your entire architecture.
Without a robust service discovery mechanism, autoscaled services are unable to communicate. Once discoverable, the next challenge is distributing traffic intelligently to prevent any single instance from becoming a bottleneck. This is the role of load balancing, which works in concert with service discovery to build a resilient, high-performance system.
Choosing Your Service Discovery Pattern
There are two primary patterns for service discovery, and the choice has significant architectural implications.
-
Client-Side Discovery: The client service is responsible for discovering downstream service instances. It queries a service registry like Consul or Eureka, retrieves a list of healthy instances, and then applies its own client-side load-balancing logic to select one. This pattern provides granular control but increases the complexity of every client application.
-
Server-Side Discovery: This is the standard approach in modern container orchestration platforms like Kubernetes. The client sends its request to a stable virtual IP or DNS name (e.g.,
payment-service.default.svc.cluster.local). The platform intercepts the request and routes it to a healthy backend pod. The discovery logic is completely abstracted from the application code, simplifying development.
For most modern applications, particularly those deployed on Kubernetes, server-side discovery is the pragmatic choice. It decouples the application from the discovery mechanism, resulting in leaner, more maintainable services. Client-side discovery is typically reserved for legacy systems or specialized use cases requiring custom routing logic not supported by the platform.
Implementing Intelligent Load Balancing Algorithms
Once a request is routed, a load balancer selects a specific backend instance. The default round-robin algorithm, while simple, is often suboptimal for real-world workloads.
Different algorithms are suited for different use cases. A Least Connections algorithm is highly effective for services with long-lived connections. It directs new requests to the instance with the fewest active connections, ensuring a more even distribution of load.
Another powerful technique is Weighted Routing. This allows you to distribute traffic across different service versions by percentage, which is fundamental for implementing canary releases. For example, you can route 95% of traffic to a stable v1.0 and 5% to a new v1.1 for production testing. Mastering these techniques is critical; you can explore hands-on tutorials in guides on load balancing configuration.
A common mistake is applying a single load-balancing strategy across all services. A stateless API may perform well with round-robin, but a stateful, connection-intensive service requires a more intelligent algorithm like least connections or IP hashing to maintain session affinity.
The adoption of these scalable architectures is a major market shift. The global cloud microservices market reached USD 1.84 billion in 2024 and is projected to grow to USD 8.06 billion by 2032. This is driven by the fact that 85% of enterprises are now leveraging microservices for increased agility. More data on this trend is available in this rapid market expansion on amraandelma.com.
Using a Service Mesh for Advanced Scalability
As your microservices architecture grows, inter-service communication becomes a complex web of dependencies where a single slow service can trigger a cascading failure. At this scale, managing network-level concerns like retries, timeouts, and mTLS within each application's code becomes an untenable source of boilerplate, inconsistency, and technical debt.
A service mesh like Istio or Linkerd addresses this challenge by abstracting network communication logic out of your applications and into a dedicated infrastructure layer.
It operates by injecting a lightweight network proxy, typically Envoy, as a "sidecar" container into each of your service's pods. This sidecar intercepts all inbound and outbound network traffic, enabling centralized control over traffic flow, resilience policies, and security without modifying application code.
Offloading Resilience Patterns
A primary benefit of a service mesh is offloading resilience patterns. Instead of developers implementing retry logic in the Order service for calls to the Payment service, you configure these policies declaratively in the service mesh control plane.
During a high-traffic incident where the Inventory service becomes overloaded, the service mesh can automatically:
- Implement Smart Retries: Retry failed requests with exponential backoff and jitter, giving the overloaded service time to recover without being overwhelmed by a thundering herd of retries.
- Enforce Timeouts: Apply consistent, fine-grained timeouts to prevent a calling service from blocking indefinitely on a slow downstream dependency.
- Trip Circuit Breakers: After a configured number of consecutive failures, the mesh can "trip a circuit," immediately failing subsequent requests to the unhealthy service instance for a cooldown period. This isolates the failure and prevents it from cascading.
This provides a self-healing capability that is essential for maintaining stability in a complex production environment.
By moving this logic to the infrastructure layer, you empower platform engineering teams to manage system-wide resilience policies. This allows application developers to focus exclusively on business logic, accelerating development velocity. This separation of concerns is fundamental to scaling engineering teams alongside your services.
Implementing Canary Deployments with Precision
Deploying new code in a large-scale distributed system carries inherent risk. A service mesh de-risks this process by enabling precise traffic management for canary deployments.
When releasing a new recommendations-v2 service, you can use the service mesh's traffic-splitting capabilities to define routing rules with surgical precision.
A typical canary release workflow would be:
- Route 99% of traffic to the stable
recommendations-v1and 1% to the newrecommendations-v2. - Monitor key performance indicators (KPIs) for v2, such as error rates and p99 latency, in a metrics dashboard.
- If KPIs remain within acceptable thresholds, incrementally increase the traffic percentage to v2—to 10%, then 50%, and finally 100%.
If the new version exhibits any regressions, you can instantly revert traffic back to the stable version via a single configuration change. This level of control transforms deployments from high-risk events into routine, low-impact operations, enabling rapid and safe innovation at scale.
Monitoring Your Scaled Microservices Performance
Operating a scaled microservices architecture without deep observability is untenable. Without robust monitoring, you are guessing about performance and resource utilization. With hundreds of ephemeral instances, you require comprehensive visibility to diagnose issues effectively. This is achieved through the three pillars of observability: metrics, logs, and traces.
Without this trifecta, debugging is a slow, painful process. A single user request may traverse numerous services, and pinpointing a latency bottleneck without proper tooling is nearly impossible. Effective monitoring transforms this chaos into a data-driven process for identifying and resolving issues.
Beyond Averages: The Metrics That Matter
Aggregate metrics like average CPU utilization are often misleading in a distributed system. A service can be failing for a specific subset of users while its overall CPU usage appears normal. You must track metrics that directly reflect service health and user experience.
Tools like Prometheus excel at collecting these high-cardinality, application-level metrics:
- p99 Latency: This tracks the response time for the slowest 1% of requests. While average latency may be acceptable, a high p99 latency indicates that a significant number of users are experiencing poor performance. It is a critical metric for defining and monitoring Service Level Objectives (SLOs).
- Request Queue Saturation: For asynchronous services, this measures the depth of the message queue. A persistently growing queue is a leading indicator that consumer services cannot keep pace with producers, signaling a need to scale out.
- Error Rate per Endpoint: Do not rely on a single, system-wide error rate. Segment error rates by API endpoint. A spike in HTTP 500 errors on
/api/checkoutis a critical incident, whereas intermittent errors on a non-critical endpoint may be less urgent.
The goal is to transition from reactive infrastructure monitoring ("the pod is down") to proactive application performance monitoring ("the checkout latency SLO is at risk"). When alerts are tied to user-impacting behavior, you can resolve problems before they become outages.
To guide your monitoring strategy, here are essential metrics across the three pillars of observability.
Key Metrics for Monitoring Scaled Microservices
| Observability Pillar | Metric to Track | Why It's Critical for Scaling | Example Tool |
|---|---|---|---|
| Metrics | p99 Latency | Reveals the worst-case user experience, which averages hide. Essential for SLOs. | Prometheus |
| Metrics | Error Rate (per service/endpoint) | Pinpoints specific functionalities that are failing as you add more load or instances. | Grafana |
| Metrics | Saturation (e.g., Queue Depth) | A leading indicator of a bottleneck; shows when a service can't keep up with demand. | AWS CloudWatch |
| Logging | Log Volume & Error Count | Spikes can indicate a widespread issue or a misbehaving service flooding the system. | Kibana (ELK Stack) |
| Logging | Log Correlation (by trace_id) |
Groups all logs for a single request, making cross-service debugging possible. | Logz.io |
| Tracing | Trace Duration | Shows the end-to-end time for a request across all services involved. | Jaeger |
| Tracing | Span Errors & Latency | Drills down into the performance of individual operations within a service. | Datadog |
| Tracing | Service Dependency Graph | Visually maps how services interact, helping identify unexpected dependencies or bottlenecks. | OpenTelemetry Collector |
This table provides a robust starting point for building dashboards that deliver actionable insights, not just noise.
Making Sense of the Noise with Structured Logging
In a scaled environment, logs are emitted from hundreds of ephemeral instances per second. Manual inspection via tail -f is impossible. Structured logging is essential for turning this high-volume data stream into a searchable, useful resource. Services must emit logs in a machine-readable format like JSON, not unstructured text.
A well-formed structured log entry includes key-value pairs:
{
  "timestamp": "2024-10-27T10:00:05.123Z",
  "level": "error",
  "service": "payment-service",
  "trace_id": "a1b2c3d4-e5f6-7890-1234-567890abcdef",
  "message": "Credit card processor timeout",
  "duration_ms": 2500,
  "customer_id": "cust-9876"
}
This format enables a centralized logging platform like the ELK Stack (Elasticsearch, Logstash, Kibana) to index the data. You can then execute powerful queries, such as "Show me all error logs from the payment-service where duration_ms > 2000." This transforms logging from a passive data store into an active diagnostic tool.
Pinpointing Bottlenecks with Distributed Tracing
Distributed tracing is the definitive tool for debugging performance in a microservices architecture. It allows you to visualize the entire lifecycle of a request as it propagates through multiple services. This is typically implemented using tools like Jaeger and open standards like OpenTelemetry.
When a user reports that a page is slow, a trace provides a waterfall diagram showing the time spent in each service and at each "span" (a single operation). You can immediately see how much time was spent in the API Gateway, the Auth Service, the Order Service, and the database. You might discover that the Order Service is fast, but it spends 90% of its time waiting for a slow response from a downstream Product Service. The bottleneck is instantly identified.
This level of insight is non-negotiable for effectively operating microservices at scale. It's why companies using this architecture report performance improvements of 30-50%, according to McKinsey. With 74% of organizations using microservices in 2024, the ability to debug them efficiently is a key differentiator. More data is available on microservices market trends on imarcgroup.com. Without tracing, you are not debugging; you are guessing.
Frequently Asked Questions About Scaling Microservices
Even with a solid plan, scaling microservices introduces complex challenges. Here are technical answers to some of the most common questions that arise.
https://www.youtube.com/embed/TS6MaeK1w9w
How Do You Handle Database Scaling?
Database scaling is often the primary bottleneck in a microservices architecture. While stateless services can scale horizontally with ease, the stateful database layer requires a more deliberate strategy.
Initially, vertical scaling ("scaling up") by adding more CPU, RAM, or faster storage to the database server is a common first step. This approach is simple but has a finite ceiling and creates a single point of failure.
For true scalability, you must eventually pursue horizontal scaling ("scaling out").
Key horizontal scaling strategies include:
- Read Replicas: This is the first and most impactful step for read-heavy workloads. You create read-only copies of your primary database. Write operations go to the primary, while read operations (often 80-90% of traffic) are distributed across the replicas. This significantly reduces the load on the primary database instance.
- Sharding: This is the strategy for massive-scale applications. Data is partitioned horizontally across multiple, independent databases (shards). For example, a
customerstable could be sharded bycustomer_idranges or by region. Each shard is a smaller, more manageable database, enabling near-infinite horizontal scaling. The trade-off is a significant increase in application logic complexity and operational overhead. - CQRS (Command Query Responsibility Segregation): This advanced architectural pattern separates the models for writing data (Commands) and reading data (Queries). You might use a normalized relational database for writes and a separate, denormalized read model (e.g., in Elasticsearch) optimized for specific query patterns. This allows you to scale and optimize the read and write paths independently.
Database scaling is an evolutionary process. Start with read replicas to handle initial growth. Only adopt the complexity of sharding or CQRS when your data volume and write throughput absolutely demand it.
What Is the Difference Between Horizontal and Vertical Scaling?
This distinction is fundamental to microservices architecture.
Vertical scaling ("scaling up") means increasing the resources of a single machine (e.g., more CPU cores, more RAM). It is simple to implement as it requires no application code changes, but it is limited by the maximum size of a single server and is not fault-tolerant.
Horizontal scaling ("scaling out") means adding more machines or instances to a resource pool. This is the core principle behind cloud-native design. Stateless services are designed specifically for this, allowing you to add identical instances to handle increased load. This approach provides near-limitless scalability and inherent fault tolerance.
When Should You Implement a Service Mesh?
A service mesh is a powerful but complex tool. It should not be adopted on day one. Implement a service mesh like Istio or Linkerd only when the problems it solves are more painful than the operational complexity it introduces.
It's time to consider a service mesh when:
- Observability becomes unmanageable: You can no longer easily trace a request across your 10+ services to diagnose latency issues. A service mesh provides this visibility out of the box.
- Security becomes a major concern: You need to enforce mTLS (mutual TLS) between all services, and managing certificates and configurations manually has become brittle and error-prone.
- You require advanced traffic control: You need to implement canary releases, A/B testing, or circuit breakers without embedding that complex logic into every application.
A service mesh is a tool for managing complexity at scale. For smaller systems, the native capabilities of an orchestrator like Kubernetes are often sufficient.
At OpsMoon, we specialize in designing, building, and managing the robust infrastructure required to scale microservices effectively. Our DevOps experts can help you implement a scalable architecture, set up advanced observability, and automate your deployments to ensure your system is prepared for growth. Get in touch with us at opsmoon.com for a free work planning session and let's engineer your path to scale.