Mastering Autoscaling in Kubernetes: A Technical Guide
 By opsmoon
A practical guide to mastering autoscaling in Kubernetes. Learn to configure HPA, VPA, and Cluster Autoscaler with real-world examples and expert tips.
Autoscaling in Kubernetes is not a single feature but a cooperative system of components designed to dynamically align compute resources with application demand. This process is governed by three primary controllers: the Horizontal Pod Autoscaler (HPA), the Vertical Pod Autoscaler (VPA), and the Cluster Autoscaler (CA). Each serves a distinct purpose in achieving cluster elasticity.
A precise understanding of these controllers is crucial before defining scaling policies in YAML. They are the mechanisms that allow a Kubernetes cluster to respond to fluctuating workloads, ensuring resource availability without incurring unnecessary costs from idle infrastructure. Mastering this trio is a cornerstone of modern cloud-native application development, where workload predictability is often low.
Understanding the Kubernetes Autoscaling Trio
Before writing a line of YAML, it's essential to understand how these three controllers function and interact. They form a layered approach to resource management, enabling a Kubernetes cluster to be truly elastic. Each controller addresses a different dimension of scaling, ensuring applications have the resources they need while minimizing waste.
The Three Layers of Scaling
Think of these as three layers of automated resource management for your applications.
-
Horizontal Pod Autoscaler (HPA): This controller adjusts the number of pod replicas in a Deployment, ReplicaSet, or StatefulSet. It is the primary mechanism for reacting to changes in load, such as traffic spikes. The HPA makes scaling decisions based on observed metrics like CPU utilization or custom metrics exposed via the Metrics API. It answers the question: "Do I need more or fewer instances of my application running?"
-
Vertical Pod Autoscaler (VPA): The VPA focuses on resource efficiency by adjusting the CPU and memory
requestsandlimitsfor the containers within your pods. It analyzes historical resource usage to recommend or automatically apply optimal values, ensuring individual pods are right-sized. It answers the question: "Are my running pods configured with the correct resource allocations?" -
Cluster Autoscaler (CA): This controller operates at the infrastructure level. When the Kubernetes scheduler cannot place a pod due to insufficient resources on any existing nodes (a
Pendingstate with aFailedSchedulingevent), the CA provisions new nodes from the underlying cloud provider. Conversely, it decommissions underutilized nodes to reduce costs. Its job is to answer the question: "Does the cluster itself have sufficient node capacity for all scheduled and pending workloads?"
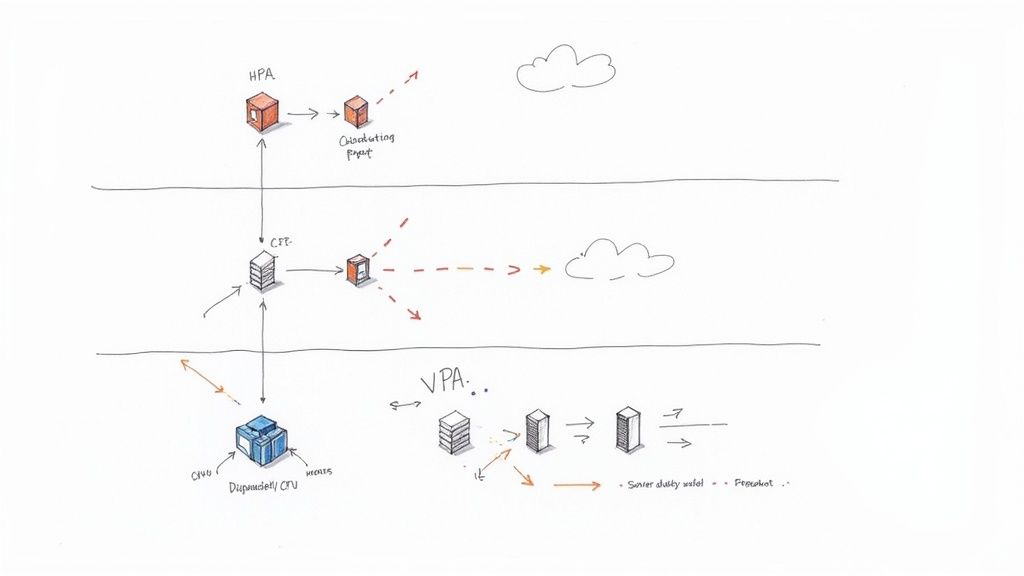
This diagram illustrates the distinct responsibilities of each autoscaler.
As you can see, each tool has a specific role: scaling pod replicas, resizing container resource requests, or adjusting the node count. This multi-faceted strategy is a key reason for Kubernetes' dominance. With over 5.6 million developers now using Kubernetes and enterprise adoption reaching 96%, these intelligent autoscaling capabilities are a significant driver of its success. You can learn more about these Kubernetes adoption statistics here.
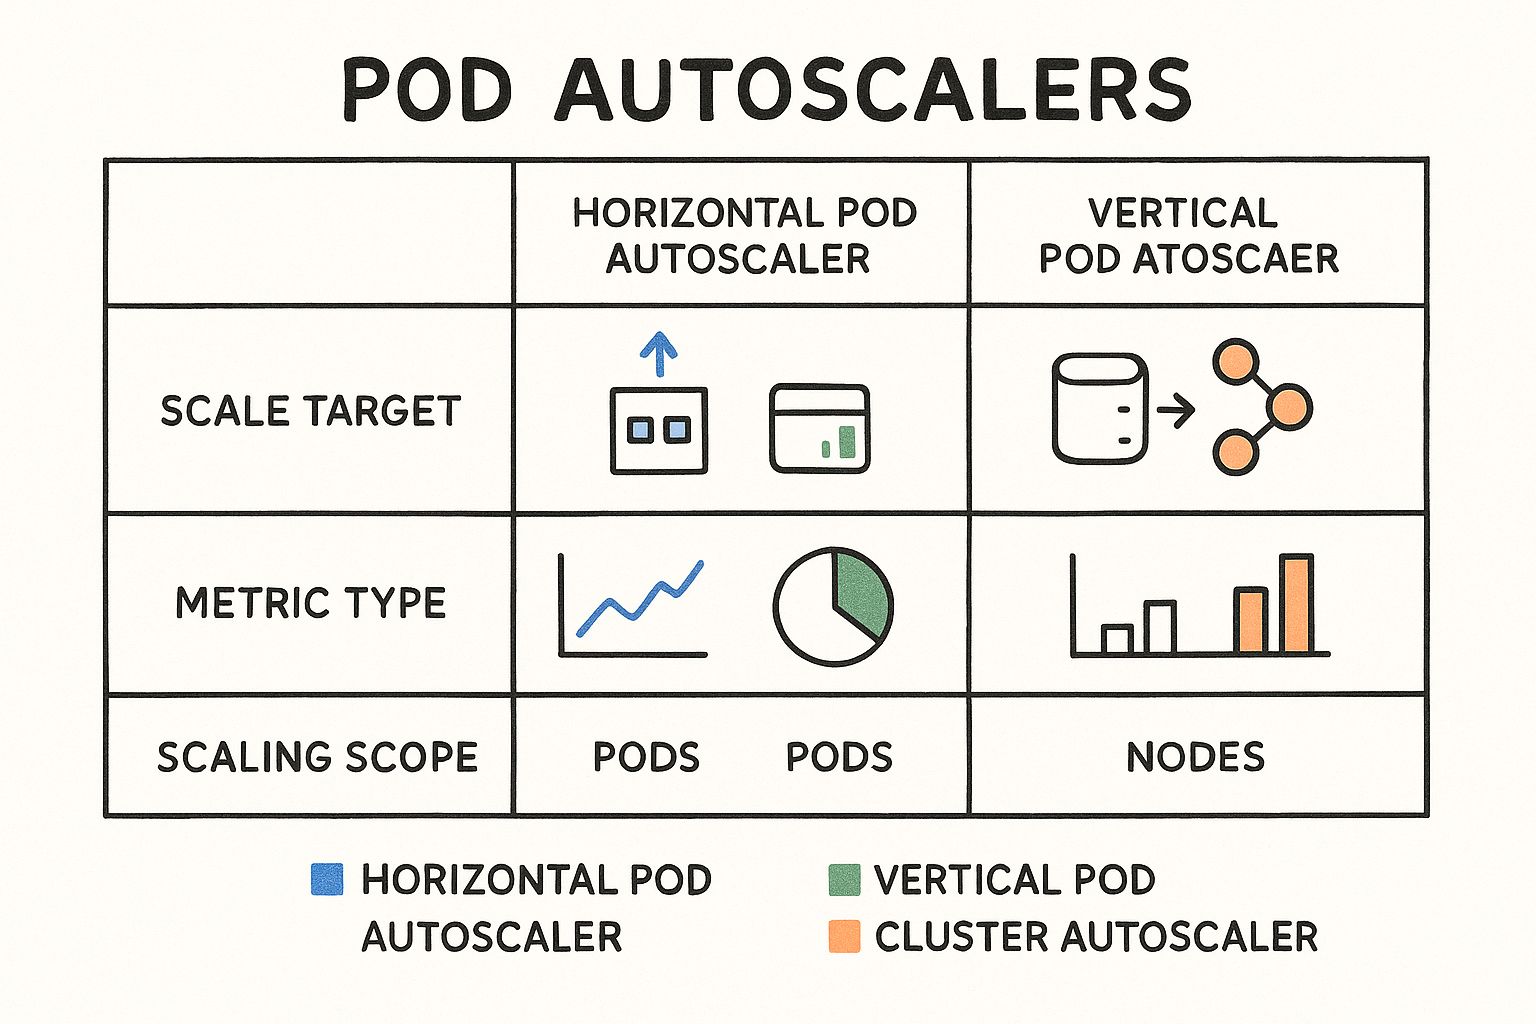
To provide a more technical comparison, here is a breakdown of their functions.
Kubernetes Autoscaler Comparison
| Autoscaler | Target Resource | Scaling Trigger | Primary Use Case |
|---|---|---|---|
| Horizontal Pod Autoscaler (HPA) | Pod Replicas (in a Deployment/ReplicaSet) | Real-time metric utilization (CPU, memory, custom metrics) exceeding a defined threshold. | Responding to fluctuating load for stateless, horizontally scalable applications. |
| Vertical Pod Autoscaler (VPA) | Container CPU/Memory requests & limits |
Analysis of historical resource consumption patterns. | Right-sizing resource allocations for stateful applications or determining optimal settings for any workload. |
| Cluster Autoscaler (CA) | Cluster Nodes (in a managed node group) | Pods in a Pending state due to insufficient cluster-wide resources. |
Dynamically adjusting the size of the cluster's node pool to match overall workload demands. |
Each autoscaler is a critical component of a comprehensive scaling strategy. The HPA adds more workers, the VPA ensures each worker is appropriately equipped, and the CA makes sure there's enough physical space for all the workers.
Setting Up Your Cluster for Autoscaling
Effective autoscaling in Kubernetes is a data-driven process. The fundamental prerequisite for both HPA and VPA is a reliable stream of resource metrics. This is provided by the Kubernetes Metrics Server.
The Metrics Server is a cluster-level component that aggregates resource usage data from each node's Kubelet. It collects CPU and memory metrics and exposes them through the Kubernetes Metrics API (metrics.k8s.io). This API is the data source that HPA and VPA controllers query to make scaling decisions. Without a functioning Metrics Server, these autoscalers are inoperative as they have no data to act upon.
Deploying the Metrics Server
In most environments, deploying the Metrics Server is straightforward using the official manifest provided by the Kubernetes SIGs project.
This command deploys the necessary components, including the Deployment, ServiceAccount, and required RBAC roles, into the kube-system namespace.
kubectl apply -f https://github.com/kubernetes-sigs/metrics-server/releases/latest/download/components.yaml
This manifest is generally sufficient for standard Kubernetes installations on major cloud providers. However, certain environments, particularly local clusters like Docker Desktop or clusters with strict network policies, may require a configuration modification. The Metrics Server attempts to communicate with Kubelets over TLS, and if it cannot verify their self-signed certificates, it will fail.
To resolve this, you must add the --kubelet-insecure-tls argument to the container's command in the Metrics Server deployment manifest. This can be done by patching the deployment post-installation or by modifying the YAML file before applying it.
Verifying Your Installation
After applying the manifest, allow a minute for the pod to initialize. Verify its status:
kubectl get pods -n kube-system -l k8s-app=metrics-server
You should see a pod with a Running status. If the pod is in a CrashLoopBackOff state, inspect its logs (kubectl logs -n kube-system <metrics-server-pod-name>). The most common issue is the TLS verification failure mentioned previously.
The definitive test is querying the Metrics API using kubectl top. This command directly consumes the API exposed by the Metrics Server.
First, verify node metrics:
kubectl top nodes
Next, verify pod metrics across all namespaces:
kubectl top pods -A
Critical Takeaway: If
kubectl topreturns an error such as "Metrics API not available," you must halt and troubleshoot the Metrics Server installation. No autoscaling controller that relies on resource metrics will function until this API is accessible.
Successful output from both commands confirms that your data pipeline is operational. The HPA and VPA controllers can now query the Metrics API to retrieve the real-time data needed for intelligent autoscaling in Kubernetes.
Implementing Horizontal Pod Autoscaling

With the Metrics Server providing the necessary data, we can implement the most common form of autoscaling in Kubernetes: the Horizontal Pod Autoscaler (HPA). The HPA is ideal for scaling stateless workloads, such as web servers or APIs, by adjusting the replica count in response to demand.
First, we require a workload to scale. The following manifest deploys a simple PHP application designed to perform CPU-intensive calculations. Note the critical resources.requests block; the HPA uses this value as the denominator when calculating the utilization percentage (currentCPU / requestedCPU).
apiVersion: apps/v1
kind: Deployment
metadata:
  name: php-apache
spec:
  selector:
    matchLabels:
      run: php-apache
  replicas: 1
  template:
    metadata:
      labels:
        run: php-apache
    spec:
      containers:
      - name: php-apache
        image: k8s.gcr.io/hpa-example
        ports:
        - containerPort: 80
        resources:
          requests:
            cpu: 200m
Apply this manifest to your cluster to create the deployment that the HPA will manage.
Creating the HPA Imperatively
For quick tests or development work, the kubectl autoscale command provides an imperative way to create an HPA without writing a YAML file. This is useful for rapidly verifying that the autoscaler targets the correct workload and receives metrics.
The following command creates an HPA targeting the php-apache deployment. It is configured to maintain an average CPU utilization of 50% across all pods, with a replica range of one to ten.
kubectl autoscale deployment php-apache --cpu-percent=50 --min=1 --max=10
This command creates a fully functional HPA resource. While efficient, a declarative approach is recommended for production environments.
The Declarative YAML Approach for Production
For production systems, defining the HPA declaratively in a YAML manifest is best practice. This approach enables version control, auditing, and repeatable deployments across multiple environments, adhering to GitOps principles.
Here is the declarative equivalent of the imperative command above:
apiVersion: autoscaling/v2
kind: HorizontalPodAutoscaler
metadata:
  name: php-apache-hpa
spec:
  scaleTargetRef:
    apiVersion: apps/v1
    kind: Deployment
    name: php-apache
  minReplicas: 1
  maxReplicas: 10
  metrics:
  - type: Resource
    resource:
      name: cpu
      target:
        type: Utilization
        averageUtilization: 50
Save this as hpa.yaml and apply it. This manifest explicitly defines the scaleTargetRef, scaling boundaries (minReplicas, maxReplicas), and the metric trigger. Using the autoscaling/v2 API version is highly recommended as it supports scaling on multiple metrics simultaneously, including custom and external metrics.
Generating Load and Observing HPA in Action
The HPA controller queries metrics at a default interval of 15 seconds. To trigger a scale-up event, we must generate load against our application to increase its CPU usage. A simple method is to run a temporary pod that continuously sends requests to the service.
# Create a temporary pod with networking tools and get a shell
kubectl run -i --tty load-generator --rm --image=busybox -- /bin/sh

# From inside the load-generator pod's shell, execute a request loop
# First, you'll need to expose the php-apache deployment via a service.
# In another terminal: kubectl expose deployment php-apache --port=80
# Then, back in the load-generator shell:
while true; do wget -q -O- http://php-apache; done
With the load generator running, open a second terminal and watch the HPA status using the -w (watch) flag.
kubectl get hpa php-apache-hpa -w
You will observe the TARGETS column, which shows current versus target utilization (<current>/<target>), increase beyond the 50% threshold. Within moments, the REPLICAS count will increment as the HPA controller adds pods to distribute the load and bring the average CPU utilization back toward the 50% target.
Expert Tip: The HPA's decision-making process is transparent. To understand why a scaling event occurred (or did not), use the
describecommand:kubectl describe hpa php-apache-hpa. TheEventssection provides a detailed log of its scaling decisions and metric observations.
For deeper analysis, integrating HPA metrics into one of the best infrastructure monitoring tools allows you to correlate scaling events with application-level performance indicators.
Once the load generator is stopped, CPU utilization will decrease. After a configurable cooldown period (defaulting to five minutes), the HPA will begin to scale the deployment back down to its minimum replica count, ensuring cost efficiency by de-provisioning unused resources.
Adding Nodes with the Cluster Autoscaler
HPA and VPA manage workloads within the existing capacity of the cluster. However, when the HPA attempts to create a new pod replica and the Kubernetes scheduler cannot find a node with sufficient allocatable resources, the pod will become stuck in a Pending state.
This scenario is the trigger for the Cluster Autoscaler (CA). This controller operates at the infrastructure level, interfacing directly with your cloud provider's API to dynamically adjust the number of nodes in the cluster.
When the CA detects pods in a Pending state due to resource constraints, it evaluates whether adding a new node from a pre-configured node group would allow the pod to be scheduled. If so, it initiates a scale-up operation, provisions a new virtual machine, and joins it to the cluster.
How it Thinks
The CA's logic is fundamentally predictive. It constantly monitors for unschedulable pods and simulates the scheduling of these pods onto new, hypothetical nodes from its managed node groups. If the simulation is successful, it triggers a scale-up.
Conversely, the CA optimizes costs by identifying and removing underutilized nodes. If a node's resource utilization drops below a configurable threshold (typically 50%) and all of its running pods can be safely rescheduled onto other nodes in the cluster, the CA will cordon and drain the node before terminating the underlying cloud instance.
This dual functionality makes autoscaling in Kubernetes a powerful tool for both performance assurance and cost optimization. The 2024 Kubernetes Benchmark Report highlights the widespread adoption of this controller in production environments, often paired with HPA for a comprehensive scaling solution. You can review the data in the full Kubernetes Benchmark Report analysis.
Provider-Specific Setups
The implementation of the Cluster Autoscaler is provider-specific. While the core logic remains consistent, the configuration for AWS, GCP, and Azure differs significantly, particularly regarding IAM permissions and node group discovery mechanisms.
- On AWS, the CA interacts with Auto Scaling Groups (ASGs). It requires an IAM role with specific permissions (e.g.,
autoscaling:SetDesiredCapacity) and identifies manageable ASGs via resource tags likek8s.io/cluster-autoscaler/enabled. - On GCP, it integrates with Managed Instance Groups (MIGs). The setup is often simplified in GKE, where enabling cluster autoscaling through the console or gcloud CLI automatically configures the necessary IAM roles.
- On Azure, it works with Virtual Machine Scale Sets (VMSS). Similar to AWS, it requires a service principal with appropriate permissions and relies on tags to identify target scale sets.
The goal across all providers is to grant the CA controller the minimum required permissions to modify the size of your underlying compute instance groups.
Defining Your Scaling Boundaries
A critical configuration aspect is setting the minimum and maximum size for each node group the CA manages. These boundaries are your primary defense against uncontrolled scaling and unexpected costs. This is typically configured via command-line flags in the CA deployment manifest.
--nodes=<min>:<max>:<nodegroup_name>
For example, --nodes=1:10:default-pool instructs the CA that the node group named default-pool can scale down to a single node but must not exceed ten nodes.
Setting a realistic
maxvalue is a crucial safety mechanism. A misconfigured HPA or a buggy application can trigger a cascading scale-up event, leading to significant cloud expenditure. Cost control is a key benefit of autoscaling; see our guide on cloud computing cost reduction for more strategies.
Protecting Critical Workloads with PDBs
The scale-down function, while beneficial for cost savings, poses a risk to application availability if not managed carefully. The CA might attempt to terminate a node running a critical singleton pod or the last replica of a service.
Pod Disruption Budgets (PDBs) are the Kubernetes-native solution to this problem.
A PDB is an API object that specifies the minimum number of replicas for a given application that must remain available during a voluntary disruption, such as a node drain initiated by the CA. The Cluster Autoscaler respects PDBs. If draining a node would violate a workload's PDB, the CA will not terminate that node.
Here is an example PDB for an application with three replicas:
apiVersion: policy/v1
kind: PodDisruptionBudget
metadata:
  name: critical-app-pdb
spec:
  minAvailable: 2
  selector:
    matchLabels:
      app: my-critical-app
This PDB enforces the rule: "At least two replicas of my-critical-app must be available at all times." When the CA considers a node for termination, it simulates the eviction of its pods and checks if any PDBs would be violated. If so, the scale-down operation on that node is aborted. Implementing PDBs is a non-negotiable best practice for stateful or critical services in any production cluster.
Getting Pod Sizes Just Right with the Vertical Pod Autoscaler
Horizontal scaling addresses load fluctuations, but it doesn't solve the fundamental problem of defining accurate CPU and memory requests for your pods. This is a persistent challenge: under-provisioning leads to CPU throttling or OOMKilled events, while over-provisioning wastes cloud resources and inflates costs.
The Vertical Pod Autoscaler (VPA) is designed specifically to solve this resource right-sizing problem.
Unlike the HPA, which adds more pod replicas, the VPA adjusts the CPU and memory requests of existing pods. It analyzes the historical consumption patterns of an application's containers and provides recommendations for optimal resource allocations, automating the otherwise manual and error-prone tuning process.
Getting VPA Up and Running
To use VPA, you must first install its components into your cluster. The official installation script from the Kubernetes autoscaler project deploys three controllers: the Recommender (which analyzes metrics and calculates recommendations), the Updater (which can evict pods to apply new resource requests), and the Admission Controller (which injects the new resource requests into pods as they are recreated).
Once installed, you configure VPA by creating a VerticalPodAutoscaler custom resource. This object specifies a targetRef (e.g., a Deployment) and an updateMode.
The updateMode is the most critical setting, controlling VPA's behavior:
Off: VPA operates in a recommendation-only mode. TheRecommenderanalyzes usage and populates the VPA object with its findings, but no pods are evicted or modified.Recreate: VPA actively manages pod resources. If a running pod's requests deviate significantly from the recommendation, theUpdaterwill evict the pod, allowing its parent controller (e.g., Deployment) to recreate it. TheAdmission Controllerthen applies the new, optimized resource requests to the replacement pod.
VPA in Action: Using It as a Recommendation Engine
Because the Recreate mode is inherently disruptive (it requires pod termination), a common and safe pattern is to use VPA solely as a recommendation engine. This provides the benefits of data-driven resource analysis without introducing automated, potentially disruptive changes to a production environment.
The following manifest configures a VPA in this recommendation-only mode:
apiVersion: "autoscaling.k8s.io/v1"
kind: VerticalPodAutoscaler
metadata:
  name: my-app-vpa
spec:
  targetRef:
    apiVersion: "apps/v1"
    kind:       Deployment
    name:       my-app
  updatePolicy:
    updateMode: "Off"
After applying this manifest, allow the VPA to run for a period (e.g., 24-48 hours) to observe a representative load cycle. You can then inspect its recommendations:
kubectl describe vpa my-app-vpa
The output will contain a Recommendation section with lowerBound, target, and upperBound values for CPU and memory. The target value represents VPA's data-driven recommendation for the optimal resource request.
Warning: Don't Cross the Streams!
You must never configure VPA in an automated update mode (Recreate) to manage the same metric (CPU or memory) that an HPA is using as a scaling trigger. This creates a conflicting control loop: HPA will try to scale horizontally based on utilization, while VPA simultaneously tries to adjust the resource requests of individual pods, altering the utilization percentage. The two controllers will fight, leading to system instability.
The Best of Both Worlds: Combining VPA and HPA
To leverage both autoscalers effectively without conflict, use them sequentially in a two-phase process. This is the established best practice for achieving a mature autoscaling posture.
- VPA for Intelligence: Deploy a VPA with
updateMode: "Off"targeting your workload. Allow it to run and collect data, generating stable resource recommendations without any operational impact. - HPA for Action: Periodically review the
targetrecommendations provided by the VPA. Manually update theresources.requestsin your Deployment's manifest with these optimized values and deploy the changes through your standard CI/CD pipeline. With correctly sized pods as a baseline, the HPA can now function more effectively and predictably, scaling horizontally in response to load.
This methodology creates a clear separation of concerns, which is fundamental to a robust autoscaling in Kubernetes strategy. VPA performs the strategic, long-term task of resource optimization, while HPA handles the tactical, real-time response to load changes.
Building a Production-Ready Autoscaling Strategy
Enabling autoscalers is the first step; configuring them for production resilience and cost-effectiveness requires a more sophisticated approach. This involves moving beyond basic metrics and implementing safeguards to handle edge cases and prevent undesirable behavior.
A production-ready system must be predictable, stable, and resilient to unexpected application behavior or load patterns, all while preventing runaway costs.
Preventing Autoscaler Thrashing
A common issue is "thrashing," where the HPA rapidly scales replicas up and down in response to noisy or fluctuating metrics. This constant pod churn can degrade application performance and cause instability.
The solution is to configure stabilization windows and scaling policies.
The HPA behavior field allows you to define a stabilizationWindowSeconds for scale-down events. Setting this value instructs the HPA to wait for a specified period after a scale-up event before considering a scale-down, preventing it from reacting to transient dips in load. A value of 300 seconds is a common starting point.
You can further control scaling velocity with policies. For example, you can configure a policy to remove only one pod per minute during a scale-down, ensuring a gradual and controlled response to decreasing load.
The Critical Role of Health Probes
Autoscaling decisions are only as reliable as their input metrics. If the HPA includes pods in its metric calculations before they are fully initialized and ready to serve traffic, the average utilization metric will be skewed downward, potentially leading to incorrect scaling decisions.
Therefore, correctly configured readiness probes are an absolute requirement for effective autoscaling in Kubernetes.
- Readiness Probes: A readiness probe signals to Kubernetes (and by extension, the Service and HPA) when a container is ready to accept traffic. The HPA will not consider a pod's metrics in its scaling calculations until its readiness probe passes. This prevents a new pod, with its initially low CPU usage, from prematurely suppressing a scale-up event.
- Liveness Probes: While not directly used by the HPA, liveness probes are crucial for overall system health. They detect unresponsive pods, prompting Kubernetes to restart them. This removes unhealthy pods from service, preventing them from serving errors and ensuring they do not contribute faulty metrics to the autoscaler.
A well-configured readiness probe is non-negotiable for any production HPA deployment. Without it, you are providing the HPA controller with inaccurate data, which will result in suboptimal or potentially harmful scaling behavior.
Continuous Monitoring and Refinement
An autoscaling strategy is not a "set it and forget it" configuration. It is a dynamic system that requires continuous monitoring and tuning. You must observe both the behavior of the autoscalers and the performance of your application to achieve an optimal balance between performance, cost, and stability.
The financial incentive for this refinement is significant. Effective autoscaling directly improves operational efficiency and can lead to substantial cost savings. In 2025, auto-scaling infrastructure is projected to save $11.2 billion globally by reducing overprovisioning. With 94% of organizations using cloud services, this impact will continue to grow. You can explore more data on cloud adoption trends and their financial impact.
Establish a feedback loop by regularly reviewing HPA events (kubectl describe hpa) and correlating them with application performance metrics in your monitoring dashboards. This process is essential for fine-tuning your configurations and building a truly robust and efficient system.
Common Kubernetes Autoscaling Questions
As you implement autoscaling in Kubernetes, several common technical questions and challenges will arise. Addressing these is key to building a stable, efficient, and predictable system.
Can HPA And VPA Work Together
Yes, but with a critical caveat: they must not manage the same resource on the same workload simultaneously in an automated fashion. Doing so creates a conflicting control loop.
The industry-standard best practice is to use them sequentially:
- Phase 1: Recommendation (VPA): Deploy VPA with
updateMode: "Off". This configures it as a passive recommendation engine. It will analyze historical resource usage and populate its status with recommendations without affecting running pods. - Phase 2: Application (Manual): After a sufficient data collection period (e.g., several days), use the
targetrecommendation from the VPA status to manually update theresources.requestsin your Deployment manifest. - Phase 3: Horizontal Scaling (HPA): With the pods now right-sized based on empirical data, the HPA can operate effectively. Its utilization calculations will be based on a stable and accurate resource request value, leading to more predictable horizontal scaling.
Why Is My Cluster Autoscaler Not Adding Nodes
If the Cluster Autoscaler (CA) is not provisioning new nodes despite Pending pods, the root cause is typically related to permissions or configuration. The primary trigger for the CA is a pod with a FailedScheduling event due to insufficient resources (cpu, memory, etc.).
Begin your troubleshooting by confirming the presence of unschedulable pods. If they exist, investigate the following:
- Cloud Provider Permissions: This is the most common failure point. Inspect the logs of the Cluster Autoscaler pod (
kubectl logs -n kube-system <ca-pod-name>). Look for API error messages from your cloud provider. These often indicate that the IAM role or service principal associated with the CA lacks the necessary permissions to describe or modify node groups (e.g., AWS Auto Scaling Groups, GCP Managed Instance Groups). - Node Group Configuration: Verify that the target node groups are correctly tagged for discovery by the CA. Also, confirm that the node group has not already reached its configured maximum size. The CA will not scale a group beyond the
--nodes=<min>:<max>:<name>boundaries defined in its startup arguments.
In practice, the vast majority of CA failures are due to misconfigured cloud provider permissions. Always start by cross-referencing the IAM role or service principal policies with the official Cluster Autoscaler documentation for your specific cloud provider before investigating more complex issues.
At OpsMoon, our expert DevOps engineers specialize in designing, implementing, and optimizing complex Kubernetes environments. We help organizations build resilient, cost-effective autoscaling strategies tailored to their specific workloads. Book a free work planning session to map out your infrastructure roadmap today at https://opsmoon.com.