A Practical Guide to Load Balancing Configuration
 By opsmoon
Dive deep into load balancing configuration with our practical guide. Learn to set up NGINX, HAProxy, and AWS ELB with actionable code and expert tips.

A precise load balancing configuration isn't just a "nice-to-have"—it's the foundational bedrock of any high-performance application architecture. It is the intelligent traffic director standing between your users and your servers, engineered to guarantee uptime, enforce performance, and prevent catastrophic failure.
This is about more than just spreading out requests. It's a deliberate strategy to guarantee high availability and peak performance by algorithmically distributing network traffic across your backend server pool.
Why Your Load Balancing Configuration Matters
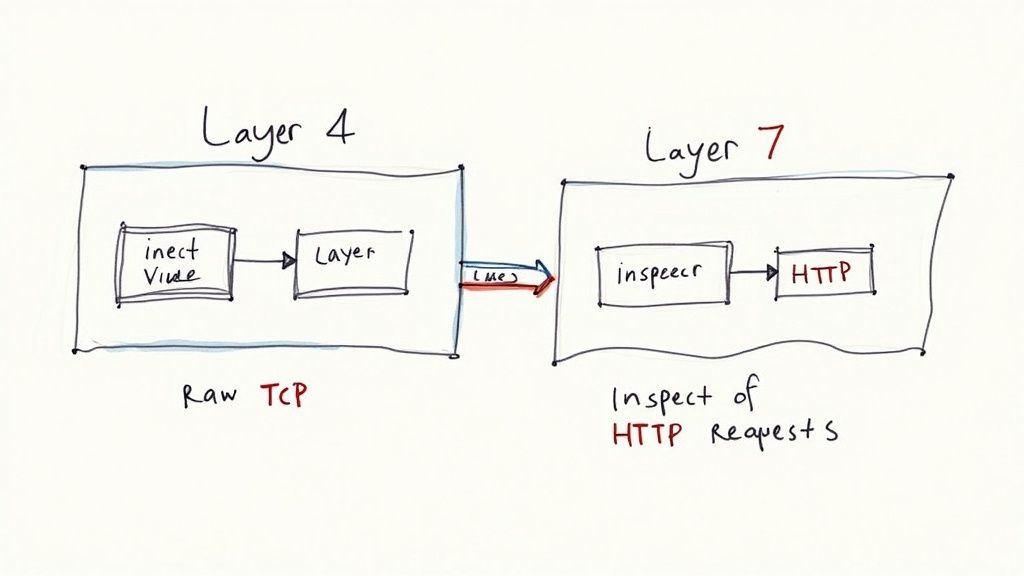
Think of your load balancer as a Layer 4/Layer 7 traffic controller for your application's network packets. Without it, a sudden flood of requests—perhaps from a marketing campaign or viral post—would hammer a single server's network interface and CPU, causing unacceptable latency or, even worse, a complete service outage.
A well-designed load balancing configuration is your first line of defense. It intelligently routes incoming requests to healthy servers, ensuring no single node in your infrastructure becomes a bottleneck. This isn't just about preventing downtime; it's about engineering a seamless user experience. A subtle misconfiguration in your setup can inject latency, trigger intermittent application errors, or even create a cascading failure across your entire system.
On the flip side, a correct and optimized configuration delivers tangible improvements in reliability and application speed.
The Impact on Availability and Performance
The primary technical objectives here are to maximize availability and minimize response times. By distributing traffic, you are architecting redundancy directly into your system's design.
If one of your servers goes offline due to hardware failure, a deployment error, or routine maintenance, the load balancer's health checks will detect the failure and instantly redirect traffic to the remaining healthy servers in the pool. From the end-user's perspective, the application remains fully operational. This is the core principle of building fault-tolerant systems that can withstand real-world component failures.
The infographic below quantifies the direct benefits of a properly implemented load balancing setup.
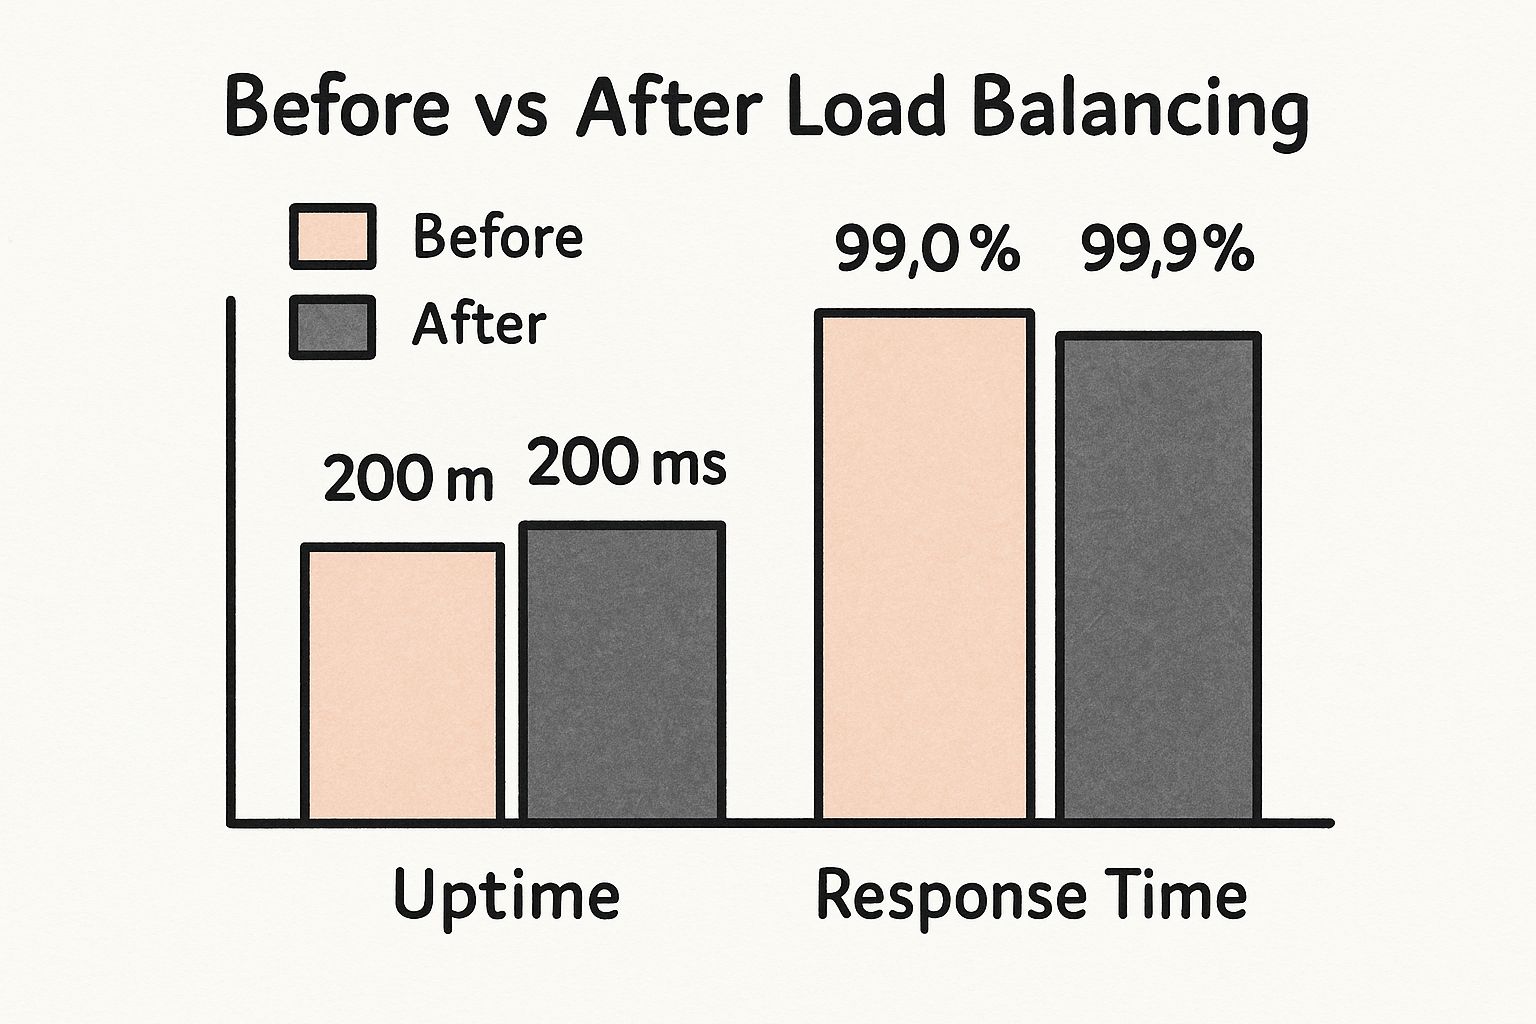
You can see clear increases in uptime percentages and decreases in average response time—metrics that directly impact user satisfaction and business KPIs.
Optimizing Costs and Scaling Efficiently
Beyond ensuring high availability, a strategic configuration is critical for managing infrastructure costs. It enables horizontal scaling—adding more smaller, commodity servers as demand grows, instead of being forced into expensive, monolithic vertical scaling. This approach provides far greater elasticity and more efficient resource utilization.
It's no surprise that the global load balancer market hit an estimated $6.2 billion in 2024 and continues to grow, driven by the relentless expansion of web traffic. For a deeper dive into the core concepts, I highly recommend this What Is Network Load Balancing? An Essential Technical Guide.
A deliberate load balancing configuration is your first line of defense against outages and your most direct path to a scalable, cost-effective, and resilient application architecture. It moves your infrastructure from a reactive state to a proactive one.
When you need a high-performance, flexible, and resource-efficient software load balancer, NGINX is an industry-standard choice. It is lightweight yet incredibly powerful, capable of serving as a reverse proxy, web server, and, for our purposes, a top-tier software load balancer.
Let's dive into the technical implementation by editing the nginx.conf file to build a practical, production-ready configuration.
The core logic of NGINX load balancing is defined within the upstream block. This is where you declare a named pool of backend servers for NGINX to proxy traffic to. It’s a beautifully simple construct for defining your application's server farm.
Defining Your Backend Server Pool
Let’s start with a foundational nginx.conf structure. You'll work inside the http context, first defining your upstream group and then instructing a server block to use it via the proxy_pass directive.
Here’s a minimal example that creates a pool named backend_servers and populates it with two application servers.
http {
    # Define the group of backend servers
    upstream backend_servers {
        server 10.0.1.10:8080; # Your first application server IP and port
        server 10.0.1.11:8080; # Your second application server IP and port
    }

    server {
        listen 80;

        location / {
            # Pass all incoming requests to the upstream group
            proxy_pass http://backend_servers;
        }
    }
}
This configuration uses the default load balancing algorithm: Round Robin. It’s as straightforward as it sounds. Requests are distributed sequentially to each server in the list. The first request goes to 10.0.1.10, the second to 10.0.1.11, the third cycles back to the first, and so on.
Influencing Traffic with Server Weights
Round Robin assumes that all backend servers are identical in capacity. However, in heterogeneous environments, you might have one server with more CPU and RAM. To handle this, you can assign a weight to each server, influencing the Round Robin algorithm's distribution.
A higher weight means that a server will receive a proportionally larger share of the traffic. This is a simple but powerful way to optimize resource utilization across a non-uniform server fleet.
Consider this modified configuration where one server has double the capacity of the others.
upstream backend_servers {
    server 10.0.1.10:8080 weight=2; # This server gets twice the traffic
    server 10.0.1.11:8080;          # Default weight is 1
    server 10.0.1.12:8080;          # Default weight is 1
}
In this setup, for every four incoming requests, 10.0.1.10 will handle two, while the other two servers each handle one. This allows you to fine-tune your load balancing configuration to match the actual hardware capabilities of your servers.
Choosing the Right Load Balancing Method
While weighted Round Robin is versatile, it isn't always the optimal choice. For applications with long-lived connections—such as file downloads, WebSocket communication, or intensive API calls—the Least Connections (least_conn) method is often a superior fit.
This algorithm intelligently forwards new requests to the server with the fewest active connections. This is highly effective at preventing one server from becoming saturated with slow, resource-heavy requests while others remain idle.
Implementing it requires a single directive within your upstream block.
upstream backend_servers {
    least_conn; # Use the Least Connections algorithm
    server 10.0.1.10:8080;
    server 10.0.1.11:8080;
    server 10.0.1.12:8080;
}
This one-line change can significantly improve performance for certain application workloads by distributing the active workload more evenly, not just the raw number of requests.
Implementing Active Health Checks
A non-negotiable component of any production-ready load balancing configuration is health checks. You must configure NGINX to automatically detect when a backend server is unresponsive or offline and temporarily remove it from the load balancing rotation.
While NGINX Plus offers advanced, active health checks, you can still build a highly reliable system with open-source NGINX by using parameters on the server directive.
max_fails: The number of consecutive failed connection attempts before NGINX marks a server as down. The default is 1.fail_timeout: The duration for which the server will be considered down aftermax_failshas been reached.
Here’s how you would implement this in practice:
upstream backend_servers {
    server 10.0.1.10:8080 max_fails=3 fail_timeout=30s;
    server 10.0.1.11:8080 max_fails=3 fail_timeout=30s;
}
With this configuration, if NGINX fails to establish a connection with a server three consecutive times, it will take that server out of rotation for 30 seconds. After the timeout expires, it will gracefully attempt to send traffic again. This simple mechanism is a fundamental building block for a resilient system that can automatically recover from transient backend failures.
Now, let's level up your traffic management capabilities with HAProxy.
While NGINX is an excellent general-purpose tool, there are scenarios where you need a more specialized instrument. When raw performance and surgical control over traffic routing are paramount, HAProxy is the tool of choice for many DevOps engineers. It's purpose-built for high-availability environments, and its performance and efficiency are legendary.
We will now construct a production-grade load balancing configuration using HAProxy. The heart of this operation is a single configuration file: haproxy.cfg. It is broken down into logical sections that are highly intuitive once you understand their purpose.
The Core Building Blocks of haproxy.cfg
All HAProxy behavior is defined in the haproxy.cfg file. It's structured into four primary sections. Mastering these is key to unlocking HAProxy's full potential.
global: This is the master control panel, holding settings that affect the entire HAProxy process. This includes performance tuning parameters (e.g.,maxconn), security settings (e.g.,chroot), and logging configurations.defaults: This section promotes a DRY (Don't Repeat Yourself) configuration. You can define common timeout settings and other parameters here that will be inherited by all subsequentfrontendandbackendblocks.frontend: A frontend defines a public-facing listener. It specifies the IP addresses and ports where HAProxy accepts incoming traffic and defines rules for how to process those connections.backend: This is your pool of application servers. Afrontendblock routes traffic to abackendblock, which then executes the load balancing algorithm to distribute requests among the defined servers. This is also where you configure health checks and session persistence.
This strict separation of concerns is what makes HAProxy so powerful, allowing for complex routing logic without creating a convoluted configuration file.
Building a Smart Frontend with ACLs
Let's configure a frontend to handle standard HTTP traffic. While a basic block could simply listen on a port and forward all traffic to a single backend, the real power of HAProxy lies in using Access Control Lists (ACLs).
An ACL is a rule that evaluates a specific condition within a request. You can inspect virtually any part of the traffic, including the URL path, an HTTP header, the source IP address, and more. You then use these ACLs to make intelligent routing decisions.
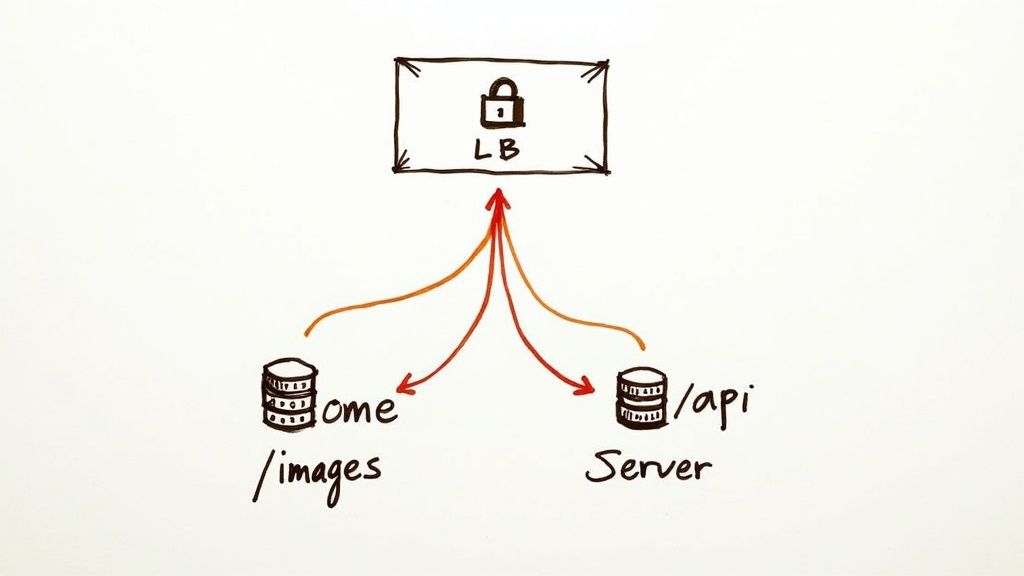
Consider a common architectural pattern: you want to route all API traffic (requests beginning with /api) to a dedicated cluster of API servers, while all other requests go to your main web servers.
Here’s the implementation in haproxy.cfg:
frontend http_in
    bind *:80

    # This ACL evaluates to true if the URL path begins with /api
    acl is_api_request path_beg /api

    # If the ACL is true, use the api_servers backend
    use_backend api_servers if is_api_request

    # This is the fallback for all other traffic
    default_backend web_servers
This is a fundamental technique for building a flexible load balancing configuration. It creates a powerful routing layer that can be easily extended. Need to route /admin traffic to a separate backend? Simply add another ACL and a use_backend rule.
Defining Backends with Health Checks and Sticky Sessions
Having defined how to route traffic in the frontend, we now need to define the backend server pools themselves. A backend is more than a list of IP addresses; it's where you define the load balancing algorithm, monitor server health, and manage user session state.
Let’s implement the two backends referenced in our frontend: web_servers and api_servers.
backend web_servers
    balance roundrobin
    # We will check the /health endpoint every 5 seconds.
    # It takes 2 successful checks to mark a server as 'up', and 3 failures to mark it 'down'.
    option httpchk GET /health
    server web1 10.0.1.10:80 check inter 5s rise 2 fall 3
    server web2 10.0.1.11:80 check inter 5s rise 2 fall 3

backend api_servers
    balance leastconn
    # For our API, we're enabling cookie-based sticky sessions.
    cookie SERVERID insert indirect nocache
    option httpchk GET /api/health
    server api1 10.0.1.20:8080 check cookie api1
    server api2 10.0.1.21:8080 check cookie api2
We've implemented several critical features here. Both backends use custom application health checks (option httpchk) that poll a specific health endpoint on the servers. The check parameter on each server line provides fine-grained control over the health check timing and failure thresholds.
The key feature in the
api_serversbackend is sticky sessions. Thecookie SERVERID insertline instructs HAProxy to set a cookie on the user's first response. On all subsequent requests from that user, HAProxy will read that cookie and ensure the user is routed to the same backend server (api1orapi2). This is absolutely critical for stateful applications that must maintain session context across multiple requests.
Setting Up Cloud Load Balancers in AWS
When you move your load balancing configuration into the cloud, you gain access to managed services that offer immense scalability and simplified operational overhead. AWS Elastic Load Balancing (ELB) is the dominant service in this space, offering a suite of load balancers for nearly any use case. For most modern, HTTP/HTTPS-based applications, the Application Load Balancer (ALB) is the optimal choice.
This represents a paradigm shift from self-hosting tools like NGINX or HAProxy. With on-premise solutions, you are responsible for the servers, the software, patching, and high availability. With AWS ELB, AWS manages the underlying hardware and software. This allows your team to focus exclusively on the routing logic: how traffic is directed, how health is monitored, and how security policies are applied.
Choosing Your AWS Load Balancer
Before beginning a configuration, you must select the correct tool for your workload. Choosing the wrong ELB type can introduce performance bottlenecks or unnecessary complexity.
Here is a technical breakdown of the ELB family:
- Application Load Balancer (ALB): This operates at the application layer (Layer 7). It is "content-aware," meaning it can inspect HTTP headers, URL paths, hostnames, and query string parameters to make sophisticated routing decisions. This is the standard choice for microservices, containerized applications (ECS/EKS), and any web application requiring flexible, path-based, or host-based routing.
- Network Load Balancer (NLB): The NLB operates at the transport layer (Layer 4) and is engineered for extreme performance and ultra-low latency. It is capable of handling millions of requests per second with minimal delay. It routes traffic based on TCP/UDP protocol data, making it ideal for high-throughput TCP workloads, gaming servers, or any application where raw network performance is the primary concern.
- Gateway Load Balancer (GWLB): This is a specialized service for deploying, scaling, and managing third-party virtual network appliances like firewalls, intrusion detection/prevention systems, and deep packet inspection systems. It functions at Layer 3 (the network layer) and provides a transparent "bump-in-the-wire" for inspecting traffic flows.
For the vast majority of web application workloads, the ALB provides the ideal balance of powerful features and excellent performance. Let's proceed with a step-by-step configuration.
Configuring an Application Load Balancer
We'll walk through setting up an ALB using the AWS Management Console. The entire configuration is based on three core components: the load balancer itself, listeners, and target groups.
Think of the relationship this way: a target group is a logical grouping of your backend resources (e.g., EC2 instances, Lambda functions) that process requests. The listener is the entry point; it checks for incoming connections on a specific port and protocol, and then uses a set of rules you define to forward that traffic to the appropriate target group.
Here is the practical workflow:
- Create a Target Group: Your first step is to define a target group. You will specify the target type (e.g., Instances), protocol, and port your backend is listening on (e.g., HTTP on port 80). Crucially, you will also configure health checks. Best practice is to create a dedicated
/healthendpoint in your application that returns a200 OKstatus code only when the application is fully healthy. - Register Your Targets: With the group created, you register your EC2 instances (or other resources) with it. As soon as a target is registered, the ALB's health checking system begins polling its health check path to determine its status.
- Create the ALB and Listener: Now, create the Application Load Balancer. You will assign it a name, select its scheme (internal or internet-facing), associate it with your VPC, and choose its subnets. Pro-tip: for high availability, you must select subnets in at least two different Availability Zones. Concurrently, you will configure a listener—a standard configuration for web traffic would be for HTTPS on port 443.
- Define Listener Rules: This is where the ALB's Layer 7 intelligence shines. You configure rules for your listener. For example, a default rule might forward all traffic to a
web-serverstarget group. You can then add a rule with a higher priority: if the URL path is/api/*, forward that traffic to a separateapi-serverstarget group. This content-based routing is essential for modern microservice architectures.
Integrating SSL/TLS for Security
No production load balancing configuration is complete without end-to-end encryption. The ALB simplifies this dramatically through its native integration with AWS Certificate Manager (ACM).
With SSL/TLS Termination, the ALB handles the computationally expensive process of decrypting incoming HTTPS traffic and encrypting responses back to the client. This offloads the cryptographic workload from your backend EC2 instances, freeing up their CPU cycles to focus on executing your application logic.
When you configure your listener, you simply select "HTTPS" as the protocol. AWS will then prompt you to select an SSL certificate from ACM. If you don't already have one, ACM can provision a free, publicly trusted certificate for your domain and will handle the automatic renewal process, eliminating a common source of operational toil and outages. For organizations seeking to implement these workflows with maximum efficiency and security, engaging expert cloud infrastructure management services can ensure best practices are applied from day one.
Once you have a functional load balancing configuration, the next phase is optimization. This involves moving beyond default settings to engineer a system that is not just operational, but genuinely resilient, performant, and secure. This fine-tuning is what separates a standard setup from a professionally optimized one, regardless of whether you're using NGINX, HAProxy, or a cloud-native solution.
These advanced strategies are not theoretical; they are battle-tested techniques used to make applications faster, more reliable, and more secure. We will explore several impactful techniques, including session persistence, SSL/TLS offloading, and implementing intelligent health monitoring.
Mastering Session Persistence
Session persistence, often called "sticky sessions," is critical for stateful applications. Consider an e-commerce shopping cart. If a user adds an item to their cart and their next HTTP request is routed to a different server that has no knowledge of their session, the cart will appear empty—a catastrophic user experience.
Sticky sessions solve this by ensuring a user is consistently routed to the same backend server for the duration of their session. Most load balancers implement this by setting a cookie. On the user's first visit, the load balancer selects a server and issues a session cookie. For all subsequent requests, the load balancer reads this cookie and forwards the traffic to the specified server.
However, this creates a single point of failure for that user's session. If that specific server fails, the user's session data is lost. For this reason, modern architectures advocate for designing stateless applications. By externalizing session state to a shared data store, like a Redis or Memcached cluster, you decouple the user session from any individual application server, making the entire architecture more robust and scalable.
Key Takeaway: Use sticky sessions as a tactical solution for legacy stateful applications. For all new development, architect for statelessness. This maximizes resilience and simplifies your load balancing configuration.
The Power of SSL/TLS Termination
Handling HTTPS traffic is computationally expensive. The cryptographic operations involved in encrypting and decrypting TLS traffic consume significant CPU cycles on your backend servers—cycles that could be better utilized running your application code. This is the problem that SSL/TLS termination solves.
By configuring your load balancer to terminate SSL/TLS, you offload this entire computational burden. The process is as follows:
- A client establishes a secure HTTPS connection to your load balancer's public IP.
- The load balancer decrypts the incoming traffic.
- It then forwards the now-unencrypted HTTP traffic to the appropriate backend server over your secure, private network.
This strategy yields two major benefits. First, it frees up your application servers, improving their performance and capacity. Second, it centralizes certificate management. Instead of managing TLS certificates and private keys on every backend server, you manage them in a single, secure location: the load balancer.
Implementing Smarter Health Checks
A basic health check that simply tests TCP connectivity on a port is insufficient. It doesn't tell the whole story. A server can be responsive to a TCP ping while the application running on it is hung, crashed, or unable to connect to its database. A truly robust load balancing configuration requires deep, application-aware health checks.
You must configure your load balancer to poll a dedicated health check endpoint, such as /healthz or /status, that is specifically designed to validate the application's operational readiness. This endpoint's logic should verify its own critical dependencies—such as database connectivity or the availability of a downstream microservice—before returning a 200 OK status code. If any of these internal checks fail, the endpoint must return a non-200 status (e.g., 503 Service Unavailable). This provides an unambiguous signal to the load balancer to immediately and automatically remove that unhealthy instance from the rotation.
The field of load balancing configuration is continually evolving. By 2024, advanced teams are exploring machine learning-driven predictive load balancing, which adjusts traffic distribution based on real-time server metrics and historical trends. There is also a major trend towards integrating API gateways directly with load balancers to provide enhanced security, rate limiting, and observability for microservice architectures. You can dive deeper into these market shifts in this detailed report on the load balancer market.
Continuously iterating and improving these configurations is a hallmark of a high-maturity DevOps team. If you are assessing your team's capabilities, a structured framework like this DevOps maturity assessment can provide invaluable insights.
Troubleshooting Common Configuration Problems
Despite meticulous planning, production systems fail. A load balancing configuration that appears perfect in staging can encounter real-world conditions that trigger unexpected behavior. This section is a technical field guide for systematically diagnosing and resolving common load balancer issues.
We will cover the most frequent failure modes: misconfigured health checks, the notorious 504 Gateway Timeout error, and session persistence failures.
The key to effective troubleshooting is a systematic approach. Abandon guesswork. Instead, analyze the specific symptoms and trace them back to their probable root causes using logs and metrics. This methodology allows you to restore service quickly and reliably.
Diagnosing Unhealthy Backend Servers
This is a classic operational scenario: you receive an alert that your load balancer has marked a backend server as 'unhealthy', yet manual inspection shows the server is running. More often than not, the issue lies with an overly aggressive health check configuration.
If your check interval is too short or your failure threshold is too low (e.g., 1 failed check), any transient event—a momentary network blip or a brief CPU spike due to garbage collection—can cause a health check to fail, tricking the load balancer into taking a perfectly healthy instance out of rotation.
Here’s the diagnostic procedure:
- Analyze Load Balancer Logs: Your load balancer's access and error logs are your primary source of truth. Look for patterns. Is one specific server "flapping" (repeatedly cycling between healthy and unhealthy states)? This almost always indicates a configuration problem, not a server failure.
- Verify the Network Path and Security Groups: Can the load balancer's nodes actually reach the backend server on the specified health check port? Check your firewall rules and security groups. A simple
curlortelnetfrom a machine within the same subnet as the load balancer can verify connectivity. - Tune Health Check Parameters: Loosen your health check thresholds to be more tolerant of transient issues. In HAProxy, this means increasing the
fallcount. In an AWS ALB, increase theUnhealthyThresholdCount. This gives a server a chance to recover from a temporary problem before being removed from service.
Resolving 504 Gateway Timeout Errors
The 504 Gateway Timeout error is an explicit message from the load balancer stating: "I forwarded a request to a backend server, but it did not respond within my configured timeout period." This is not an application error; it is a timeout at the load balancer or proxy layer.
The most frequent cause is a timeout mismatch.
Imagine your application requires 45 seconds to generate a complex report, but your load balancer’s idle timeout is configured for 30 seconds. At the 30.01-second mark, the load balancer will give up, terminate the connection to the backend, and return a 504 error to the client—even though your application server was still processing the request correctly.
To resolve this, you must ensure your load balancer's timeout value is set to be slightly higher than the maximum expected response time of your application for any given workload. This synchronization is a critical element of a stable load balancing configuration.
Fixing Broken Sticky Sessions
When sticky sessions fail, they introduce some of the most frustrating, difficult-to-reproduce bugs, such as users being randomly logged out or losing their shopping cart contents.
This failure can be traced to several root causes. The persistence cookie might be misconfigured, expired, or stripped by an intermediate proxy. The user might switch networks (e.g., from Wi-Fi to cellular), changing their source IP if IP-based persistence is used. Most commonly, the specific backend server to which the user was "stuck" has failed its health check, forcing the load balancer to re-route the user to a new server that has no context for their session.
Resolving this requires robust monitoring and often a shift in architectural thinking. Digging into application performance optimization can provide deeper strategies for tracking down these user-facing issues. By correlating server health events with user session logs, you can pinpoint the exact cause of the persistence failure.
At OpsMoon, we turn complex infrastructure challenges into streamlined, reliable systems. Our elite DevOps engineers can help you build and manage a robust load balancing configuration that scales with your business. Start with a free work planning session today!