The technical definition of uptime: a practical guide for engineers
 By opsmoon
Definition of uptime: definition of uptime explained, including how it’s measured and practical steps to boost availability.
In system engineering, uptime is the duration for which a system or service is operational and performing its primary function. It's a quantitative measure of reliability, representing the core contract between a service and its users.
This metric is almost always expressed as a percentage and serves as a critical Key Performance Indicator (KPI) for any digital product, API, or infrastructure component.
What "Uptime" Really Means in an Engineering Context
At its core, uptime provides a binary answer to a critical operational query: "Is our system functioning as specified right now?" For an e-commerce platform, this means the entire transaction pipeline—from product discovery to payment processing—is fully operational. For a SaaS application, it means users can authenticate, access data, and execute core features without encountering errors. A high uptime percentage is the clearest indicator of a resilient, well-architected system.
However, uptime is not a simple "on/off" state. A system is truly "up" only when it's performing its specified function within acceptable performance parameters. Consider a web server that is running but has a saturated connection pool, preventing it from serving HTTP requests. From a user's perspective, the system is down. This distinction is critical when instrumenting monitoring systems to measure user-facing reliability accurately.
The Core Components of Uptime Calculation
To accurately measure uptime, you must decompose it into its fundamental components. These are the primitives used to calculate, report, and ultimately improve system reliability.
- Operational Time: The total time window during which the service is expected to be available to users, as defined by its Service Level Agreement (SLA).
- Downtime: Any period within the operational time where the service is unavailable or failing to perform its primary function. This includes both unplanned outages and periods of severe performance degradation.
- Accessibility: The boolean confirmation that the service is reachable by its intended users, verified through synthetic monitoring or real user monitoring (RUM).
Uptime is more than a technical metric; it's a direct reflection of engineering quality and operational discipline. It builds user trust, protects revenue, and underpins the entire customer experience. High uptime is not achieved by accident—it is the result of a proactive, engineering-led approach to system health.
The real-world impact of a marginal decrease in this metric can be significant. One report found that when average API uptime fell from 99.66% to 99.46%, the total annual downtime increased by 60%. That seemingly minor 0.2% drop translated to a weekly downtime increase from 34 minutes to 55 minutes—a substantial disruption. You can analyze more of these reliability insights from the team at Uptrends.
Why a Precise Technical Definition Is Non-Negotiable
Establishing a clear, technical definition of uptime is the foundational step toward building resilient systems. Without it, engineering teams operate against a vague target, and the business cannot set clear expectations with customers in its SLAs.
A precise definition enables teams to implement effective monitoring, establish meaningful Service Level Objectives (SLOs), and execute incident response with clear criteria for success. This foundational understanding is a prerequisite for any mature infrastructure monitoring strategy.
To clarify these concepts, here is a quick-reference table.
Uptime At a Glance
This table breaks down the essential concepts of uptime and their technical and business implications.
| Concept | Technical Definition | Business Impact |
|---|---|---|
| Uptime | The percentage of time a system is fully operational and accessible, meeting all its performance criteria. | High uptime directly correlates with customer satisfaction, revenue generation, and brand reputation. |
| Measurement | Calculated as (Total Time - Downtime) / Total Time * 100. |
Provides a clear, quantitative benchmark for setting SLOs and tracking reliability engineering efforts. |
| Business Value | The assurance that digital services are consistently available to meet user and business demands. | Protects against financial losses, customer churn, and damage to credibility caused by outages. |
Ultimately, a technical understanding of uptime is about quantifying the health and operational promise of your digital services.
How to Calculate Uptime With Technical Precision
Calculating uptime requires a rigorous, objective methodology. A precise calculation is the bedrock of any reliability engineering practice—without it, you're operating on assumptions, not data.
The standard formula is straightforward in principle:
Uptime % = ((Total Scheduled Time – Downtime) / Total Scheduled Time) * 100
However, the critical work lies in defining the variables. If "downtime" is not defined with technical specificity, the resulting percentage is operationally useless and can create friction between engineering, product, and business teams.
Defining the Variables for Accurate Calculation
To make the formula produce a meaningful metric, you must establish clear, unambiguous definitions for each component. This ensures consistent measurement across all teams and services.
- Total Scheduled Time: The total duration the service is expected to be operational. For a 24/7 service, this is the total number of minutes in a given period (e.g., a month). Crucially, this must exclude planned maintenance windows only if your Service Level Agreement (SLA) explicitly permits it.
- Downtime: Any period within the scheduled time when the system fails to meet its functional or performance requirements. Downtime must include periods of severe performance degradation. For instance, an API whose P99 latency exceeds a 2000ms threshold should be considered "down" for that period, even if it's still returning
200 OKresponses.
This dashboard provides a clear visualization of these metrics: average uptime percentage juxtaposed with the change in total downtime.
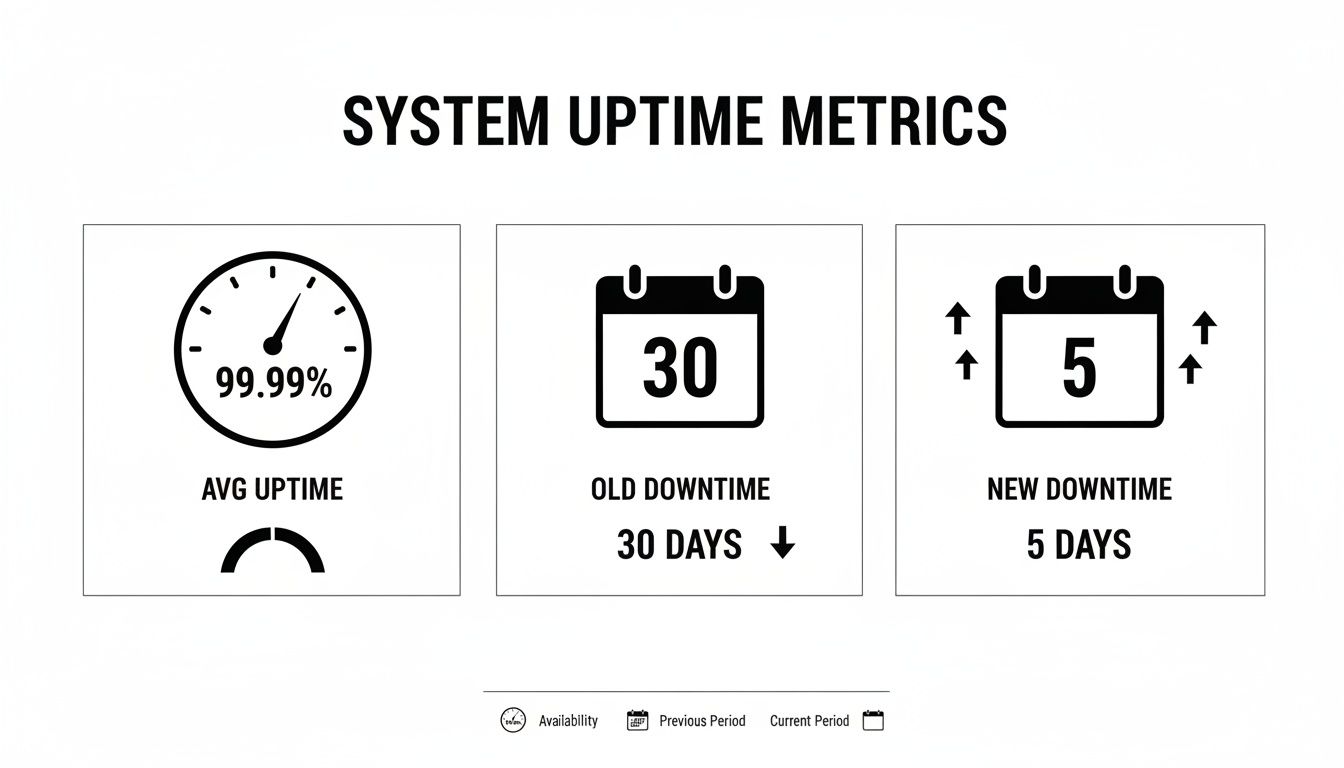
This provides a direct feedback loop on reliability initiatives. A rising uptime percentage must correlate with a measurable reduction in service unavailability.
Applying the Uptime Formula: A Practical Example
Let's apply this to a real-world scenario. Assume a core e-commerce API experienced a 45-minute outage during a 30-day month.
- Calculate Total Scheduled Time in minutes:
- 30 days * 24 hours/day * 60 minutes/hour = 43,200 minutes
- Quantify total Downtime:
- The outage duration is 45 minutes.
- Plug these values into the formula:
- Uptime % = ((43,200 – 45) / 43,200) * 100
- Uptime % = (43,155 / 43,200) * 100
- Uptime % = 99.896%
In a distributed microservices architecture, this becomes more complex. If a non-critical product recommendation service fails but the primary checkout flow remains operational, is the entire system down? The answer lies in your Service Level Objectives (SLOs). A best practice is to calculate uptime independently for each critical user journey.
The primary goal is not merely reducing outage duration but minimizing the time to full recovery. This is where metrics like Mean Time To Recovery (MTTR) are paramount. A low MTTR is the direct output of robust observability, well-defined runbooks, and automated incident response systems. To improve your incident response capabilities, it's essential to implement strategies that lower your Mean Time To Recovery.
Translating Uptime Percentages into Downtime Reality
Abstract percentages like "99.9% uptime" can obscure the operational reality. The following table translates these common targets—often referred to as "the nines"—into the corresponding "downtime budget" they allow.
Translating Uptime Percentages into Downtime Reality
| Uptime Percentage | The Nines | Downtime per Day | Downtime per Week | Downtime per Month | Downtime per Year |
|---|---|---|---|---|---|
| 99% | Two Nines | 14m 24s | 1h 40m 48s | 7h 18m 17s | 3d 15h 39m |
| 99.9% | Three Nines | 1m 26s | 10m 5s | 43m 50s | 8h 45m 57s |
| 99.95% | 43s | 5m 2s | 21m 55s | 4h 22m 58s | |
| 99.99% | Four Nines | 8.6s | 1m 1s | 4m 23s | 52m 36s |
| 99.999% | Five Nines | 0.86s | 6s | 26s | 5m 15s |
| 99.9999% | Six Nines | 0.086s | 0.6s | 2.6s | 31.6s |
This table highlights the exponential difficulty of increasing reliability. The transition from "three nines" to "four nines" reduces the acceptable annual downtime from over eight hours to under one hour—a significant engineering investment requiring mature operational practices.
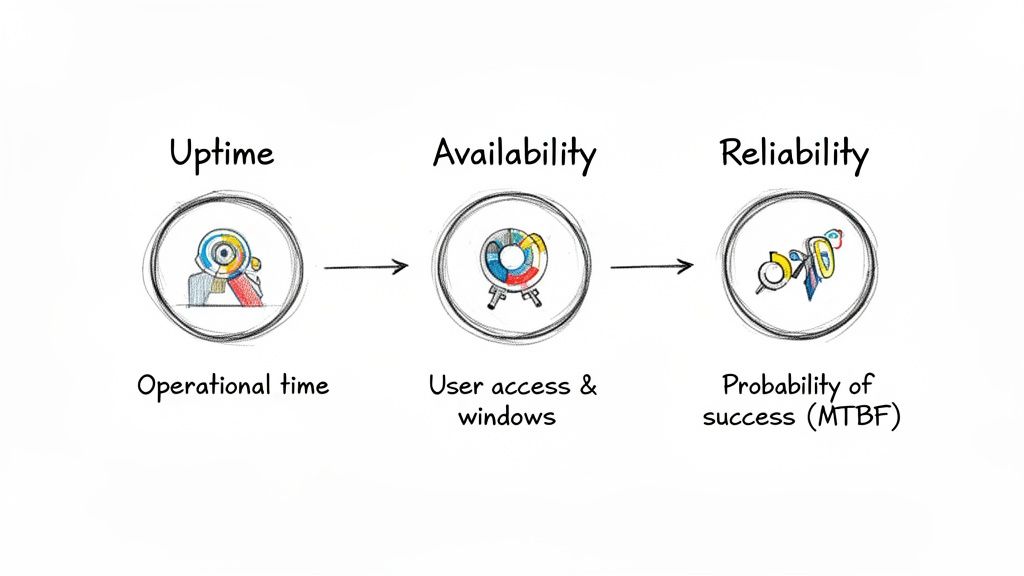
Uptime vs. Availability vs. Reliability
In engineering, precise terminology is essential for setting clear objectives and avoiding costly misinterpretations. While often used interchangeably, uptime, availability, and reliability are distinct concepts. Understanding these distinctions is fundamental to establishing a mature engineering culture.
Uptime is the most basic measure. It is a raw, quantitative metric of a system's operational state. Is the server powered on? Are the application processes running? Uptime is system-centric and does not account for whether the service is accessible or performing its function correctly.
Availability, in contrast, is user-centric. A system can have high uptime but zero availability. This is a critical distinction. Availability answers the definitive question: "Can a user successfully execute a transaction on the service right now?" It encompasses the entire service delivery chain, including networking, firewalls, load balancers, and dependencies.
For example, a database server could have 100% uptime, but if a misconfigured network ACL blocks all incoming connections, its availability is 0%. Uptime metrics would report green while the service is effectively offline for users.
Differentiating Uptime from Availability
The fundamental difference is perspective: uptime is system-centric, while availability is user-centric.
Consider a fleet of autonomous delivery drones:
- Uptime: Measures the total time the drone's flight systems are powered on. A drone on a charging pad, fully powered but not in flight, contributes to uptime.
- Availability: Measures whether a drone can accept a delivery request and successfully initiate flight. A drone that is powered on (high uptime) but grounded due to being inside a no-fly zone has zero availability.
Availability is uptime plus accessibility. It is the true measure of a service's readiness to perform its function for a user and is therefore a far more valuable indicator of system health.
This distinction directly influences the formulation of Service Level Objectives (SLOs). An SLO based solely on process uptime might show 99.99%, while users experience persistent connection timeouts—a clear availability crisis masked by a misleading metric.
Introducing Reliability into the Equation
If uptime is a historical record and availability is a real-time state, reliability is a forward-looking probability. Reliability is the probability that a system will perform its required function without failure under stated conditions for a specified period. It answers the question, "What is the likelihood this service will continue to operate correctly for the next X hours?"
Reliability is measured by forward-looking metrics, primarily:
- Mean Time Between Failures (MTBF): The predicted elapsed time between inherent failures of a system during normal operation. A higher MTBF indicates a more reliable system.
- Mean Time To Repair (MTTR): The average time required to repair a failed component or device and return it to operational status. A low MTTR indicates a resilient system with effective incident response.
Returning to our drone analogy:
- Reliability: The probability that a drone can complete a full delivery mission without hardware or software failure. A drone with an MTBF of 2,000 flight hours is significantly more reliable than one with an MTBF of 200 hours.
A system can be highly available yet unreliable. Consider a web service that crashes every hour but is restarted by a watchdog process in under one second. Its availability would be extremely high—perhaps 99.99%—but its frequent failures make it highly unreliable. This instability erodes user trust, even if total downtime is minimal. This is why mature engineering teams focus on both increasing MTBF (preventing failures) and decreasing MTTR (recovering quickly).
Using SLAs and SLOs to Set Uptime Targets
While the technical definition of uptime is a clear metric, its real power is realized when used to manage expectations and drive business outcomes. This is the domain of Service Level Agreements (SLAs) and Service Level Objectives (SLOs). These instruments transform uptime from a passive metric into an active commitment.
An SLA is a formal contract between a service provider and a customer that defines the level of service expected. It contractually guarantees a specific level of uptime, often with financial penalties (e.g., service credits) for non-compliance.
An SLO, conversely, is an internal reliability target set by an engineering team. A well-architected SLO is always more stringent than the external SLA it is designed to support.
The Crucial Buffer Between SLOs and SLAs
The delta between an SLO and an SLA creates an "error budget." For example, if an SLA promises 99.9% uptime, the internal SLO might be set to 99.95%. This gap is a critical operational buffer.
This buffer provides the engineering team with a calculated risk allowance. It permits them to perform maintenance, deploy new features, or absorb minor incidents without violating the customer-facing SLA. This is how high-velocity teams balance innovation with reliability.
An SLO is your engineering team's commitment to itself. An SLA is your organization's commitment to its customers. The error budget between them is the space where calculated risks, such as feature deployments and infrastructure changes, can occur.
This strategic gap is a core principle of modern service reliability engineering, which seeks to quantify the trade-offs between the cost of achieving perfect reliability and the need for rapid innovation.
Setting Realistic Uptime Targets for Different Services
Not all services are created equal; their uptime targets must reflect their criticality. The cost and engineering effort required to achieve each additional "nine" of uptime increase exponentially. Therefore, targets must be aligned with business impact.
Consider these technical examples:
- B2B SaaS Platform: An SLO of 99.95% is a strong, achievable target. This allows for approximately 21 minutes of downtime per month, an acceptable threshold for most non-mission-critical business applications.
- Core Financial API: For a payment processing service, the stakes are far higher. An uptime target of 99.999% ("five nines") is often the standard. This provides an error budget of only 26 seconds of downtime per month, reflecting its critical function.
- Internal Analytics Dashboard: For an internal-facing tool, a more lenient target is appropriate. A 99.5% uptime SLO provides over three hours of downtime per month, which is sufficient for non-production systems.
While outage frequency is declining, dependency on third-party services introduces new failure modes. Recent analysis shows that over a nine-year period, these external providers were responsible for two-thirds of all publicly reported outages. Furthermore, IT and networking issues now account for 23% of impactful incidents. You can discover more insights on outage trends from the Uptime Institute. This data underscores the necessity of having precise SLAs with all third-party vendors.
By using SLAs and SLOs strategically, engineering leaders can manage reliability as a feature, aligning operational goals with specific business requirements.
A Practical Playbook for Engineering High Uptime
Achieving a high uptime percentage is not a matter of chance; it is the direct outcome of deliberate engineering decisions and a culture of operational excellence. Engineering for reliability means designing systems that anticipate and gracefully handle failure. This requires a systematic approach to identifying and eliminating single points of failure across architecture, infrastructure, and deployment processes.
This technical playbook outlines five core pillars for building and maintaining highly available systems. Each pillar provides actionable strategies to systematically enhance resilience.
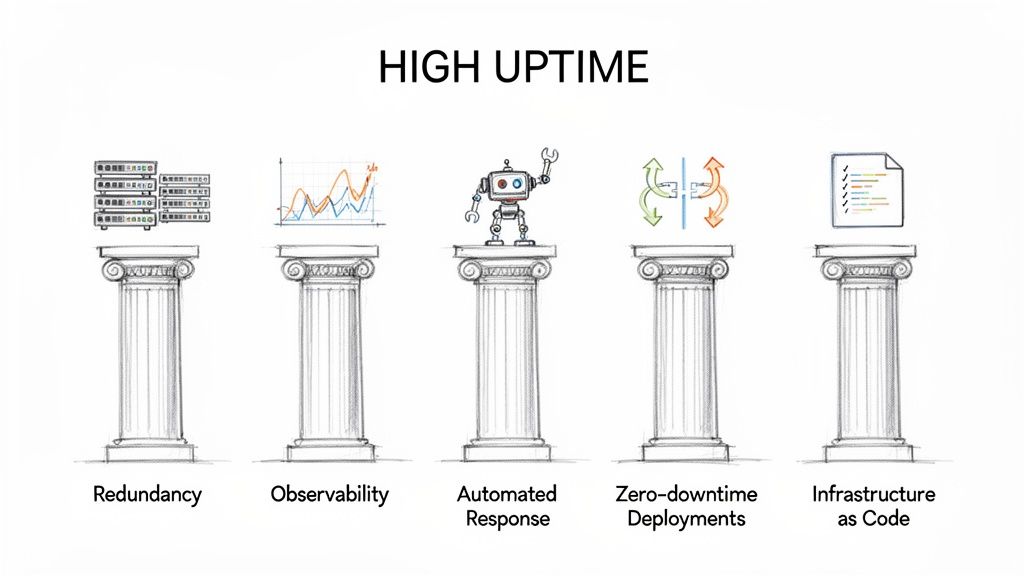
Pillar 1: Build in Architectural Redundancy
The foundational principle of high availability is the elimination of single points of failure. Architectural redundancy ensures that the failure of a single component does not cascade into a full-system outage. A redundant component is always available to take over the workload, often transparently to the user.
Key implementation tactics include:
- Failover Clusters: For stateful systems like databases, active-passive or active-active cluster configurations are essential. If a primary database node fails, a standby replica is automatically promoted, preventing a database failure from causing an application-level outage.
- Multi-Region Load Balancing: This is the highest level of redundancy. By distributing traffic across multiple, geographically isolated regions (e.g., AWS us-east-1 and us-west-2) using services like AWS Route 53 or Google Cloud Load Balancing, you can survive a complete regional outage. Traffic is automatically rerouted to healthy regions, maintaining service availability.
Pillar 2: Get Ahead with Proactive Observability
You cannot fix what you cannot see. Proactive observability involves instrumenting systems to provide deep, real-time insights into their health and performance. The objective is to detect anomalous behavior and potential issues before they escalate into user-facing outages.
True observability is not just data collection; it is the ability to ask arbitrary questions about your system's state without having to know in advance what you wanted to ask. It shifts the operational posture from reactive ("What broke?") to proactive ("Why is P99 latency increasing?").
Implementing this requires a robust monitoring stack, using tools like Prometheus for time-series metric collection and Grafana for visualization and alerting. This allows you to monitor leading indicators of failure, such as P99 latency, error rates (e.g., HTTP 5xx), and resource saturation, enabling preemptive action.
Pillar 3: Automate Your Incident Response
During an incident, every second of manual intervention increases the Mean Time To Repair (MTTR). Automated incident response aims to minimize MTTR by using software to handle common failure scenarios automatically, removing human delay and error from the recovery process.
A powerful technique is runbook automation. Pre-defined scripts are triggered by specific alerts from your observability platform. For example, an alert indicating high memory utilization on a web server can automatically trigger a script to perform a graceful restart of the application process. The issue is remediated in seconds, often before an on-call engineer is even paged.
Pillar 4: Ship Code with Zero-Downtime Deployments
Deployments are a leading cause of self-inflicted downtime. Zero-downtime deployment strategies allow you to release new code into production without interrupting service. This is a mandatory component of any modern CI/CD pipeline.
Two common strategies are:
- Blue-Green Deployments: You maintain two identical production environments ("blue" and "green"). New code is deployed to the inactive environment (green). After validation, the load balancer is reconfigured to route all traffic to the green environment. If issues arise, traffic can be instantly routed back to blue, providing near-instantaneous rollback.
- Canary Releases: The new version is gradually rolled out to a small subset of users. Its performance and error rates are closely monitored. If stable, the rollout is progressively expanded to the entire user base. This strategy minimizes the "blast radius" of a faulty deployment.
Pillar 5: Define Your Infrastructure as Resilient Code
Manually configured infrastructure is brittle and prone to human error. Resilient Infrastructure as Code (IaC), using tools like Terraform, allows you to define and manage your entire infrastructure declaratively. This ensures environments are consistent, repeatable, and easily recoverable.
With IaC, you can codify redundancy and fault-tolerant patterns, ensuring they are applied consistently across all environments. If a critical server fails, your Terraform configuration can be used to provision a new, identical instance in minutes, drastically reducing manual recovery time. Robust infrastructure is critical, as foundational issues are a common cause of outages. The weighted average Power Usage Effectiveness (PUE) in data centers has stagnated at 1.54 for six years, and half of all operators have experienced a major outage in the last three years, often due to power or cooling failures. As you can learn more about data center reliability insights here, disciplined infrastructure management is paramount.
Common Questions We Hear About Uptime
When moving from theoretical discussion to practical implementation of reliability engineering, several key questions consistently arise. These are the real-world trade-offs and definitions that engineering teams must navigate.
Let's address some of the most common questions with technical clarity.
Does Scheduled Maintenance Count as Downtime?
The definitive answer is determined by your Service Level Agreement (SLA). A well-drafted SLA will specify explicit, pre-communicated maintenance windows. Downtime occurring within these approved windows is typically excluded from uptime calculations.
However, if the maintenance exceeds the scheduled window or causes an unintended service impairment, the downtime clock starts immediately. The goal of a mature engineering organization is to leverage zero-downtime deployment techniques to make this question moot.
What Uptime Percentage Should We Even Aim For?
The appropriate uptime target is a function of customer expectations, business criticality, and budget. The pursuit of each additional "nine" of uptime has an exponential cost curve in terms of both infrastructure and engineering complexity.
A more effective approach is to frame the target in terms of its user impact and error budget:
- 99.9% ("Three Nines"): An excellent and achievable target for most SaaS products. This equates to an annual downtime budget of 8.77 hours. This level of reliability satisfies most users without requiring an exorbitant budget.
- 99.99% ("Four Nines"): This is the domain of critical services like payment gateways or core platform APIs, where downtime has a direct and immediate financial impact. The annual downtime budget is just 52.6 minutes.
- 99.999% ("Five Nines"): Reserved for mission-critical infrastructure where failure is not an option (e.g., telecommunications, core financial systems). This allows for a razor-thin 5.26 minutes of downtime per year.
How Do MTBF and MTTR Fit Into This?
Mean Time Between Failures (MTBF) and Mean Time To Repair (MTTR) are not merely related to uptime; they are the two primary variables that determine it.
Uptime is an emergent property of a high MTBF and a low MTTR.
Think of it as a two-pronged strategy:
- MTBF is a measure of reliability. It quantifies how long a system operates correctly before a failure occurs. You increase MTBF through robust architectural design, redundancy, and practices like chaos engineering.
- MTTR is a measure of recoverability. It quantifies how quickly you can restore service after a failure. You decrease MTTR through advanced observability, automated incident response, and well-rehearsed on-call procedures.
A truly resilient system is achieved by engineering improvements on both fronts. You build systems designed to fail less frequently (high MTBF) while ensuring that when they inevitably do fail, they are recovered rapidly (low MTTR).
Building and maintaining high-uptime systems requires a dedicated strategy and expert execution. At OpsMoon, we connect you with the top 0.7% of DevOps engineers who specialize in creating resilient, scalable infrastructure. Whether you need to implement zero-downtime deployments, build out multi-region redundancy, or sharpen your incident response, our experts are ready to help. Start with a free work planning session to map your path to superior reliability. Get in touch with us today.