Mastering Mean Time to Recovery: A Technical Playbook
 By opsmoon
A technical playbook for reducing downtime. Learn to calculate, measure, and improve Mean Time to Recovery (MTTR) with actionable DevOps strategies.

When a critical service fails, the clock starts ticking. The speed at which your team can diagnose, mitigate, and fully restore functionality is measured by Mean Time to Recovery (MTTR). It represents the average time elapsed from the initial system-generated alert to the complete resolution of an incident.
Think of it as the ultimate stress test of your team's incident response capabilities. In distributed systems where failures are not an 'if' but a 'when', a low MTTR is a non-negotiable indicator of operational maturity and system resilience.
Why Mean Time to Recovery Is Your Most Critical Metric
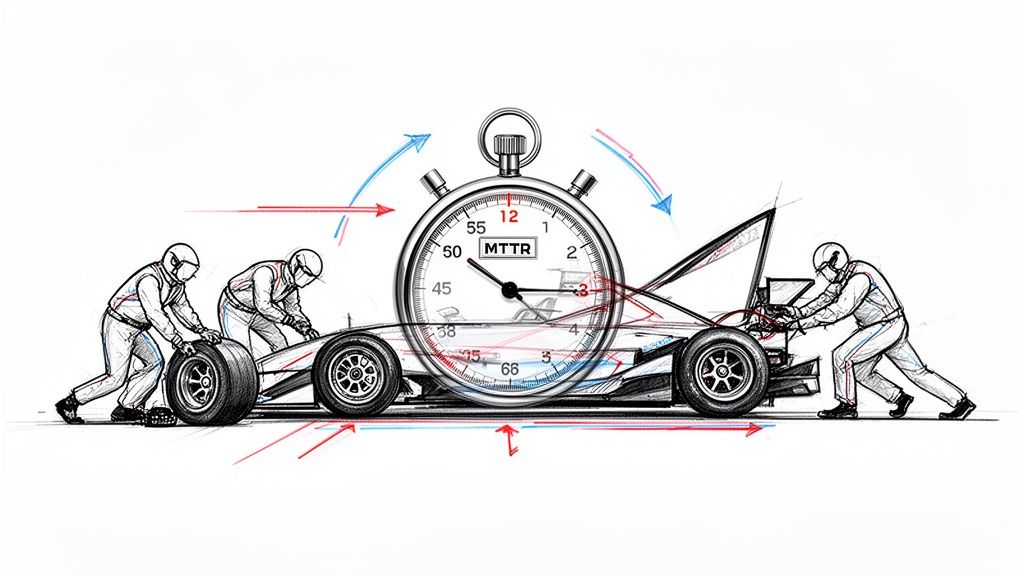
In a high-stakes Formula 1 race, the car with the most powerful engine can easily lose if the pit crew is slow. Every second spent changing tires is a second lost on the track, potentially costing the team the entire race.
That's the perfect way to think about Mean Time to Recovery (MTTR) in the world of software and DevOps. It's not just another technical acronym; it's the stopwatch on your team's ability to execute a well-orchestrated recovery from system failure.
The Business Impact of Recovery Speed
While other reliability metrics like Mean Time Between Failures (MTBF) focus on preventing incidents, MTTR is grounded in the reality that failures are inevitable. The strategic question is how quickly service can be restored to minimize impact on customers and revenue.
A low MTTR is the signature of an elite technical organization. It demonstrates mature processes, high-signal alerting, and robust automation. When a critical service degrades or fails, the clock starts ticking on tangible business costs:
- Lost Revenue: Every minute of downtime for a transactional API or e-commerce platform translates directly into quantifiable financial losses.
- Customer Trust Erosion: Frequent or lengthy outages degrade user confidence, leading to churn and reputational damage.
- Operational Drag: Protracted incidents consume valuable engineering cycles, diverting focus from feature development and innovation.
Quantifying the Cost of Downtime
The financial impact of slow recovery times can be staggering. While the global average data breach lifecycle—the time from detection to full recovery—recently hit a nine-year low, it still sits at 241 days. That’s eight months of disruption.
Even more telling, recent IBM reports show that 100% of organizations surveyed reported losing revenue due to downtime, with the average data breach costing a massive $7.42 million globally. These figures underscore the financial imperative of optimizing for rapid recovery.
Ultimately, Mean Time to Recovery is more than a reactive metric. It's a strategic benchmark for any technology-driven company. It transforms incident response from a chaotic, ad-hoc scramble into a predictable, measurable, and optimizable engineering discipline.
How to Accurately Calculate MTTR
Knowing your Mean Time to Recovery is foundational, but calculating it with precision is a technical challenge. You can plug numbers into a formula, but if your data collection is imprecise or manual, the resulting metric will be misleading. Garbage in, garbage out.
The core formula is straightforward:
MTTR = Sum of all incident durations in a given period / Total number of incidents in that period
For example, if a microservice experienced three P1 incidents last quarter with durations of 45, 60, and 75 minutes, the total downtime is 180 minutes. The MTTR would be 60 minutes (180 / 3). This indicates that, on average, the team requires one hour to restore this service.
Defining Your Start and End Points
The primary challenge lies in establishing ironclad, non-negotiable definitions for when the incident clock starts and stops. Ambiguity here corrupts your data and renders the metric useless for driving improvements.
For MTTR to be a trustworthy performance indicator, you must automate the capture of these two timestamps:
-
Incident Start Time (T-Start): This is the exact timestamp when an automated monitoring system detects an anomaly and fires an alert (e.g., a Prometheus
Alertmanagerrule transition to a 'firing' state). It is not when a customer reports an issue or when an engineer acknowledges the page. The start time must be a machine-generated timestamp. -
Incident End Time (T-End): This is the timestamp when the service is fully restored and validated as operational for all users. It is not when a hotfix is deployed or when CI/CD turns green. The clock stops only after post-deployment health checks confirm that the service is meeting its SLOs again.
By standardizing these two data points and automating their capture, you eliminate subjective interpretation from the calculation. Every incident is measured against the same objective criteria, yielding clean, reliable MTTR data that can drive engineering decisions.
A Practical Example of Timestamp Tracking
To implement this, you must integrate your observability platform directly with your incident management system (e.g., PagerDuty, Opsgenie, Jira). The goal is to create a structured, automated event log for every incident.
Here is a simplified example of an incident record in JSON format:
{
  "incident_id": "INC-2024-0345",
  "service": "authentication-api",
  "severity": "critical",
  "timestamps": {
    "detected_at": "2024-10-26T14:30:15Z",
    "acknowledged_at": "2024-10-26T14:32:50Z",
    "resolved_at": "2024-10-26T15:25:10Z"
  },
  "total_downtime_minutes": 54.92
}
In this log, detected_at is your T-Start and resolved_at is your T-End. The total duration for this incident was just under 55 minutes. By collecting structured logs like this for every incident, you can execute precise queries to calculate an accurate MTTR over any time window.
Building this automated data pipeline is a prerequisite for effective MTTR tracking. If you are starting from scratch, understanding the fundamentals of what is continuous monitoring is essential for implementing the necessary instrumentation.
Decoding The Four Types of MTTR
The acronym "MTTR" is one of the most overloaded terms in operations, often leading to confusion. Teams may believe they are discussing a single metric when, in reality, there are four distinct variants, each measuring a different phase of the incident lifecycle.
Using them interchangeably results in muddled data and ineffective improvement strategies. If you cannot agree on what you are measuring, you cannot systematically improve it.
To gain granular control over your incident response process, you must dissect each variant. This allows you to pinpoint specific bottlenecks in your workflow—from initial alert latency to final resolution.
This diagram breaks down the journey from an initial incident alert to final restoration, which is the foundation for the most common MTTR calculation.
Notice that the clock starts the moment an alert is triggered, not when a human finally sees it. It only stops when the service is 100% back online for users.
Mean Time to Recovery
This is the most holistic of the four metrics and the primary focus of this guide. Mean Time to Recovery (or Restore) measures the average time from the moment an automated alert is generated until the affected service is fully restored and operational for end-users. It encompasses the entire incident lifecycle from a system and user perspective.
Use Case: Mean Time to Recovery is a powerful lagging indicator of your overall system resilience and operational effectiveness. It answers the crucial question: "When a failure occurs, what is the average duration of customer impact?"
Mean Time to Respond
This metric, often called Mean Time to Acknowledge (MTTA), focuses on the initial phase of an incident. Mean Time to Respond calculates the average time between an automated alert firing and an on-call engineer acknowledging the issue to begin investigation.
A high Mean Time to Respond is a critical red flag, often indicating systemic issues like alert fatigue, poorly defined escalation policies, or inefficient notification channels. It is a vital leading indicator of your team's reaction velocity.
Mean Time to Repair
This variant isolates the hands-on remediation phase. Mean Time to Repair measures the average time from when an engineer begins active work on a fix until that fix is developed, tested, and deployed. It excludes the initial detection and acknowledgment time.
This is often called "wrench time." This metric is ideal for assessing the efficiency of your diagnostic and repair processes. It helps identify whether your team is hampered by inadequate observability, complex deployment pipelines, or insufficient technical documentation.
- Recovery vs. Repair: It is critical to distinguish these two concepts. Recovery is about restoring user-facing service, which may involve a temporary mitigation like a rollback or failover. Repair involves implementing a permanent fix for the underlying root cause, which may occur after the service is already restored for users.
Mean Time to Resolve
Finally, Mean Time to Resolve is the most comprehensive metric, covering the entire incident management process from start to finish. It measures the average time from the initial alert until the incident is formally closed.
This includes recovery and repair time, plus all post-incident activities like monitoring the fix, conducting a post-mortem, and implementing preventative actions. Because it encompasses these administrative tasks, it is almost always longer than Mean Time to Recovery and is best used for evaluating the efficiency of your end-to-end incident management program.
Actionable Strategies to Reduce Your MTTR
Knowing your Mean Time to Recovery is the first step. Systematically reducing it is what distinguishes elite engineering organizations.
Lowering MTTR is not about pressuring engineers to "work faster" during an outage. It is about methodically engineering out friction from the incident response lifecycle. This requires investment in tooling, processes, and culture that enable your team to detect, diagnose, and remediate failures with speed and precision.
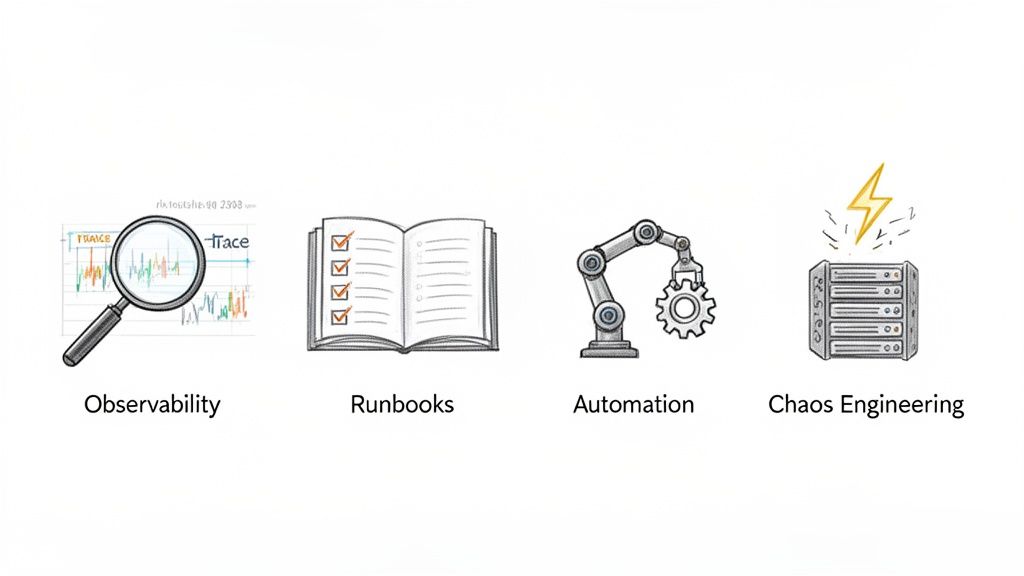
The objective is to make recovery a predictable, well-rehearsed procedure—not a chaotic scramble. We will focus on four technical pillars that deliver the most significant impact on your recovery times.
Implement Advanced Observability
You cannot fix what you cannot see. Basic monitoring may tell you that a system is down, but true observability provides the context to understand why and where it failed. This is the single most effective lever for reducing Mean Time to Detection (MTTD) and Mean Time to Repair.
A robust observability strategy is built on three core data types:
- Logs: Structured (e.g., JSON), queryable logs from every component provide the granular, event-level narrative of system behavior.
- Metrics: Time-series data from infrastructure and applications (e.g., CPU utilization, API latency percentiles, queue depth) are essential for trend analysis and anomaly detection.
- Traces: Distributed tracing provides a causal chain of events for a single request as it traverses multiple microservices, instantly pinpointing bottlenecks or points of failure.
Consider a scenario where an alert fires for a P95 latency spike (a metric). Instead of SSH-ing into hosts to grep through unstructured logs, an engineer can query a distributed trace for a slow request. The trace immediately reveals that a specific database query is timing out. This shift can compress hours of diagnostic guesswork into minutes of targeted action.
A mature observability practice transforms your system from a black box into a glass box, providing the high-context data needed to move from "What is happening?" to "Here is the fix" in record time.
Build Comprehensive and Dynamic Runbooks
A runbook should be more than a static wiki document; it must be an executable, version-controlled guide for remediating specific failures. When an alert fires for High API Error Rate, the on-call engineer should have a corresponding runbook at their fingertips.
Effective runbooks, ideally stored as code (e.g., Markdown in a Git repository), should include:
- Diagnostic Commands: Specific
kubectlcommands, SQL queries, or API calls to verify the issue and gather initial data. - Escalation Policies: Clear instructions on when and how to escalate to a subject matter expert or secondary responder.
- Remediation Procedures: Step-by-step instructions for common fixes, such as initiating a canary rollback, clearing a specific cache, or failing over to a secondary region.
- Post-Mortem Links: Hyperlinks to previous incidents of the same type to provide critical historical context.
The key is to make these runbooks dynamic. Review and update them as part of every post-mortem process. This creates a powerful feedback loop where institutional knowledge is codified and continuously refined. Our guide to incident response best practices provides a framework for formalizing these critical processes.
Leverage Intelligent Automation
Every manual step in your incident response workflow is an opportunity for human error and a source of latency. Automation is the engine that drives down mean time to recovery by removing manual toil and decision-making delays from the critical path.
Target repetitive, low-risk tasks for initial automation:
- Automated Rollbacks: Configure your CI/CD pipeline (e.g., Jenkins, GitLab CI, Spinnaker) to automatically initiate a rollback to the last known good deployment if error rates or latency metrics breach predefined thresholds immediately after a release.
- Automated Diagnostics: Trigger a script or serverless function upon alert firing to automatically collect relevant logs, metrics dashboards, and traces from the affected service and post them into the designated incident Slack channel.
- ChatOps Integration: Empower engineers to execute simple remediation actions—like scaling a service, restarting a pod, or clearing a cache—via secure commands from a chat client.
This level of automation not only accelerates recovery but also frees up senior engineers to focus on novel or complex failures that require deep system knowledge.
Run Proactive Chaos Engineering Drills
The most effective way to improve at recovering from failure is to practice failing under controlled conditions. Chaos engineering is the discipline of proactively injecting controlled failures into your production environment to identify systemic weaknesses before they manifest as user-facing outages.
Treat these as fire drills for your socio-technical system. By running scheduled experiments—such as terminating Kubernetes pods, injecting network latency between services, or simulating a cloud region failure—you can:
- Validate Runbooks: Do the documented remediation steps actually work as expected?
- Test Automation: Does the automated rollback trigger correctly when error rates spike?
- Train Your Team: Provide on-call engineers with hands-on experience managing failures in a low-stress, controlled environment.
This proactive approach builds institutional muscle memory. When a real incident occurs, it is not a novel event. The team can respond with confidence and precision because they have executed similar recovery procedures before. This mindset is proving its value industry-wide. For instance, in cybersecurity, over 53% of organizations now recover from ransomware attacks within a week—a 51% improvement from the previous year, demonstrating the power of proactive response planning. You can learn more about how enterprises are improving their ransomware recovery capabilities on BrightDefense.com.
Connecting MTTR to SLOs and Business Outcomes
To a product manager or executive, Mean Time to Recovery can sound like an abstract engineering metric. Its strategic value is unlocked when you translate it from technical jargon into the language of business impact by linking it directly to your Service Level Objectives (SLOs).
An SLO is a precise, measurable reliability target for a service. While many SLOs focus on availability (e.g., 99.95% uptime), this only captures the frequency of success. It says nothing about the duration and impact of failure. MTTR completes the picture.
When you define an explicit MTTR target as a component of your SLO, you are making a formal commitment to your users about the maximum expected duration of an outage.
From Technical Metric to Business Promise
Integrating MTTR into your SLOs fundamentally elevates the conversation around reliability. It transforms the metric from a reactive statistic reviewed in post-mortems to a proactive driver of engineering priorities and architectural decisions.
When a team commits to a specific MTTR, they are implicitly committing to building the observability, automation, and processes required to meet it. This creates a powerful forcing function that influences how the entire organization approaches system design and operational readiness.
An SLO without an accompanying MTTR target is incomplete. It's like having a goal to win a championship without a plan to handle injuries. A low Mean Time to Recovery is the strategic plan that protects your availability SLO and, by extension, your customer's trust.
This connection forces teams to address critical, business-relevant questions:
- On-Call: Is our on-call rotation, tooling, and escalation policy engineered to support a 30-minute MTTR goal?
- Tooling: Do our engineers have the observability and automation necessary to diagnose and remediate incidents within our target window?
- Architecture: Is our system architected for resilience, with patterns like bulkheads, circuit breakers, and automated failover that facilitate rapid recovery?
Suddenly, a conversation about MTTR becomes a conversation about budget, staffing, and technology strategy.
A Tangible Scenario Tying MTTR to an SLO
Let's consider a practical example. An e-commerce company defines two core SLOs for its critical payment processing API over a 30-day measurement period:
- Availability SLO: 99.9% uptime.
- Recovery SLO: Mean Time to Recovery of less than 30 minutes.
The 99.9% availability target provides an "error budget" of approximately 43.8 minutes of permissible downtime per month. Now, observe how the MTTR target provides critical context. If the service experiences a single major incident that takes 60 minutes to resolve, the team has not only failed its recovery SLO but has also completely exhausted its error budget for the entire month in one event.
This dual-SLO framework makes the cost of slow recovery quantitatively clear. It demonstrates how a single, poorly handled incident can negate the reliability efforts of the entire month.
This creates a clear mandate for prioritizing reliability work. When an engineering lead proposes investing in a distributed tracing platform or dedicating a sprint to automating rollbacks, they can justify the effort directly against the business outcome of protecting the error budget. By framing technical work in this manner, you can master key Site Reliability Engineering principles that tie operational performance directly to business success.
Moving Beyond Recovery to True Resilience
When a system fails due to a code bug or infrastructure issue, a low mean time to recovery is the gold standard. Restoring service as rapidly as possible is the primary objective. However, when the incident is a malicious cyberattack, the playbook changes dramatically.
A fast recovery can be a dangerous illusion if it reintroduces the very threat you just fought off.
Modern threats like ransomware don't just disrupt your system; they embed themselves within it. Restoring from your most recent backup may achieve a low MTTR but could also restore the malware, its persistence mechanisms, and any backdoors the attackers established. This is where the traditional MTTR metric is dangerously insufficient.
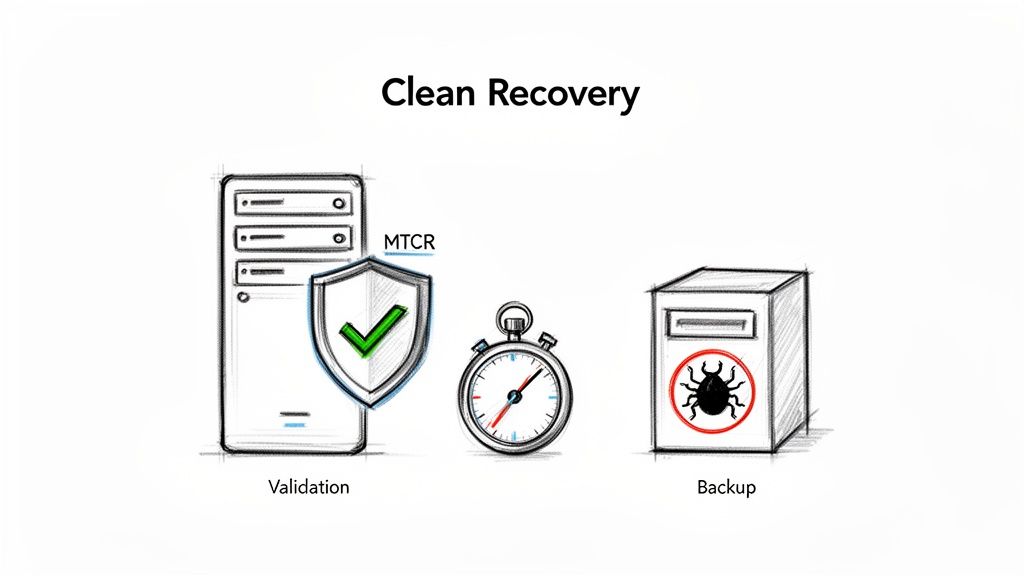
This reality has led to the emergence of a more security-aware metric: Mean Time to Clean Recovery (MTCR). MTCR measures the average time from the detection of a security breach to the restoration of your systems to a verifiably clean and trusted state.
The Challenges of a Clean Recovery
A clean recovery is fundamentally different from a standard system restore. It is a meticulous, multi-stage forensic and engineering process requiring tight collaboration between DevOps, SecOps, and infrastructure teams.
Here are the technical challenges involved:
- Identifying the Blast Radius: You must conduct a thorough forensic analysis to determine the full scope of the compromise—which systems, data stores, credentials, and API keys were accessed or exfiltrated.
- Finding a Trusted Recovery Point: This involves painstakingly analyzing backup snapshots to identify one created before the initial point of compromise, ensuring you do not simply re-deploy the attacker's foothold.
- Eradicating Adversary Persistence: You must actively hunt for and eliminate any mechanisms the attackers installed to maintain access, such as rogue IAM users, scheduled tasks, or modified system binaries.
- Validating System Integrity: Post-restore, you must conduct extensive vulnerability scanning, integrity monitoring, and behavioral analysis to confirm that all traces of the malware and its artifacts have been removed before declaring the incident resolved.
This process is inherently more time-consuming and deliberate. Rushing it can lead to a secondary breach, as attackers leverage their residual access to strike again, often with greater impact.
When a Fast Recovery Is a Dirty Recovery
The delta between a standard MTTR and a security-focused MTCR can be enormous. A real-world ransomware attack on a retailer illustrated this point. While the initial incident was contained quickly, the full, clean recovery process extended for nearly three months.
The bottleneck was not restoring servers; it was the meticulous forensic analysis required to identify trustworthy, uncompromised data to restore from. This highlights why traditional metrics like Recovery Time Objective (RTO) are inadequate for modern cyber resilience. You can find more insights on this crucial distinction for DevOps leaders on Commvault.com.
In a security incident, the objective is not just speed; it is finality. A clean recovery ensures the incident is truly over, transforming a reactive event into a strategic act of building long-term resilience against sophisticated adversaries.
Your Top MTTR Questions, Answered
To conclude, let's address some of the most common technical and strategic questions engineering leaders have about Mean Time to Recovery.
What Is a Good MTTR for a SaaS Company?
There is no universal "good" MTTR. The appropriate target depends on your system architecture, customer expectations, and defined Service Level Objectives (SLOs).
However, high-performing DevOps organizations, as identified in frameworks like DORA metrics, often target an MTTR of under one hour for critical services. The optimal approach is to first benchmark your current MTTR. Then, set incremental improvement goals tied directly to your SLOs and error budgets. Focus on reducing MTTR through targeted investments in observability, automation, and runbook improvements.
How Can We Start Measuring MTTR with No System in Place?
Begin by logging timestamps manually in your existing incident management tool, be it Jira or a dedicated Slack channel. The moment an incident is declared, record the timestamp. The moment it is fully resolved, record that timestamp. This will not be perfectly accurate, but it will establish an immediate baseline.
Your first priority after establishing a manual process is to automate it. This is non-negotiable for obtaining accurate data. Integrate your monitoring platform (e.g., Prometheus), alerting system (e.g., PagerDuty), and ticketing tool (e.g., Jira) to capture
detected_atandresolved_attimestamps automatically. This is the only way to eliminate bias and calculate your true MTTR.
Does a Low MTTR Mean Our System Is Reliable?
Not necessarily. A low MTTR indicates that your team is highly effective at incident response—you are excellent firefighters. However, true reliability is a function of both rapid recovery and infrequent failure.
A genuinely reliable system exhibits both a low MTTR and a high Mean Time Between Failures (MTBF). Focusing exclusively on reducing MTTR can inadvertently create a culture that rewards heroic firefighting over proactive engineering that prevents incidents from occurring in the first place. The goal is to excel at both.
At OpsMoon, we connect you with the top 0.7% of DevOps talent to build resilient systems that not only recover quickly but also fail less often. Schedule a free work planning session to start your journey toward elite operational performance.