What Is Infrastructure Monitoring A Practical Guide
 By opsmoon
Understand what is infrastructure monitoring through this practical guide. Learn to track key metrics, choose the right tools, and implement a winning strategy.
Infrastructure monitoring is the continuous, real-time collection and analysis of telemetry data—metrics, logs, and traces—from every component of an IT environment. Its primary function is to ensure the health, performance, and availability of the underlying systems that support applications.
Think of it as the instrumentation and control system for your entire tech stack—from physical or virtual servers, databases, and network devices, to container orchestrators like Kubernetes and the cloud services you depend on.
The core objective is to detect and resolve performance degradation and service outages before they impact end-users or disrupt business operations, by transforming raw operational data into actionable signals.
Understanding the Core of Infrastructure Monitoring
Operating a modern, distributed application without infrastructure monitoring is analogous to flying an airliner without an instrument panel. You would have zero visibility into critical system states like altitude (resource utilization), airspeed (throughput), or engine temperature (component health). Monitoring provides the real-time telemetry required to understand system behavior under load and make informed operational decisions.
On a technical level, this process involves deploying agents or leveraging APIs to collect telemetry data from every layer of the stack. This data stream is then ingested by a centralized platform for processing, analysis, visualization, and alerting. This is how raw data points, such as node_cpu_seconds_total from a Prometheus exporter or a 5xx error code in a web server log, are converted into actionable intelligence that drives incident response and system optimization.
Infrastructure monitoring is not merely a defensive measure against outages. It is a foundational practice for Site Reliability Engineering (SRE) and DevOps, enabling the creation of resilient, high-performance systems that can scale and evolve with business demands. It provides the feedback loop essential for operational excellence.
Why Monitoring Is a Business Necessity
This practice has evolved far beyond observing server status indicators. The digital infrastructure monitoring market was valued at a substantial USD 4.51 billion in 2022 and is projected to reach USD 10.26 billion by 2030. This significant growth highlights its critical role in maintaining the availability and performance of digital services that are the backbone of modern enterprises.
The ultimate objective is to transition from a reactive "break-fix" operational model to a proactive, and ultimately predictive, one. A well-implemented monitoring strategy empowers engineering teams to:
- Anticipate Failures: Identify performance degradation and resource saturation (e.g., disk I/O wait times increasing) long before they trigger a system-wide failure.
- Optimize Resource Allocation: Analyze historical utilization data to inform capacity planning, preventing over-provisioning and reducing cloud spend.
- Accelerate Troubleshooting: When an incident occurs, correlated metrics, logs, and traces enable engineers to pinpoint the root cause in minutes instead of hours, significantly reducing Mean Time to Resolution (MTTR).
By implementing a robust monitoring strategy, you create a data-driven feedback loop that informs the entire software development lifecycle. Our guide on infrastructure monitoring best practices provides the actionable steps required to build this foundation.
The Architecture of a Modern Monitoring System
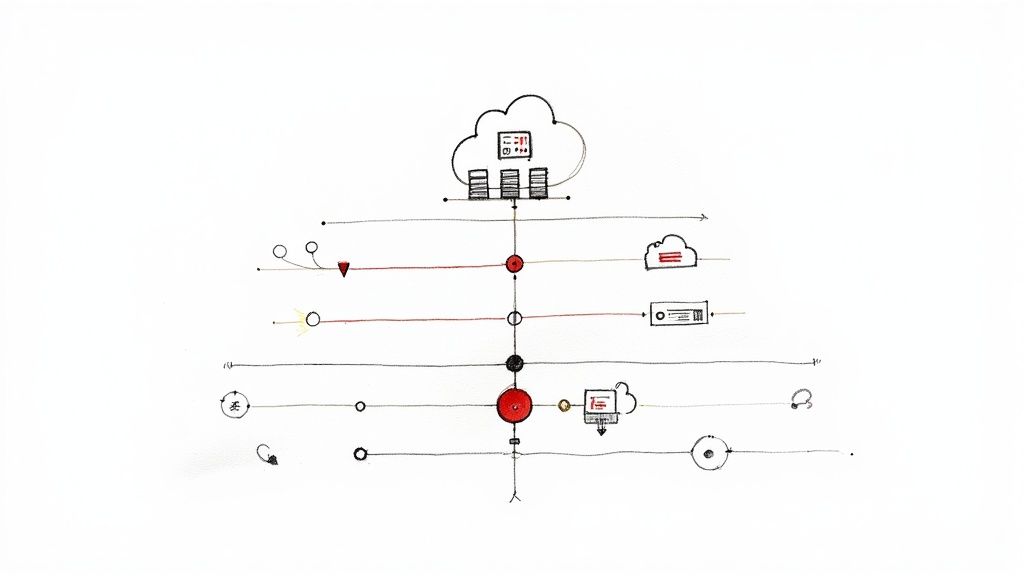
To fully grasp what infrastructure monitoring is, it's essential to understand its architecture. How does a raw metric from a server's kernel translate into a meaningful alert that prevents a production outage? Modern monitoring systems are sophisticated data pipelines, engineered to convert high-volume, noisy telemetry into clear, actionable signals about system health.
This entire process is structured in distinct layers, each performing a specific function.
It begins at the source with data collection. Lightweight software agents (e.g., Prometheus node_exporter, Datadog Agent) or collectors (e.g., OpenTelemetry Collector) are deployed across the infrastructure—on bare-metal servers, VMs, inside container sidecars, or on network switches via SNMP. These agents are responsible for gathering high-cardinality telemetry: metrics (numerical measurements), logs (timestamped event records), and traces (request lifecycle data).
From there, the raw data is pushed or pulled to the next stage. It's important to note that the underlying system architecture—such as the difference between a Monolith Vs Microservices Architecture—dramatically impacts the complexity and design of the required monitoring solution.
Data Processing And Storage
Once collected, telemetry data is transmitted to a central processing and storage layer. This is the core of the monitoring system. Here, raw data is parsed, normalized, enriched with metadata (e.g., adding Kubernetes pod labels), and aggregated to optimize storage and query performance. For instance, high-frequency CPU metrics collected every second might be downsampled into one-minute averages for long-term trend analysis.
This processed data is then written to a specialized database optimized for handling time-stamped information, known as a time-series database (TSDB). Well-known examples include Prometheus, InfluxDB, and VictoriaMetrics. These databases are engineered for extremely high write throughput and efficient querying of time-series data, which is critical for real-time dashboards and alert evaluation.
This data flow, from collection to alerting, represents the fundamental workflow of any modern monitoring system.
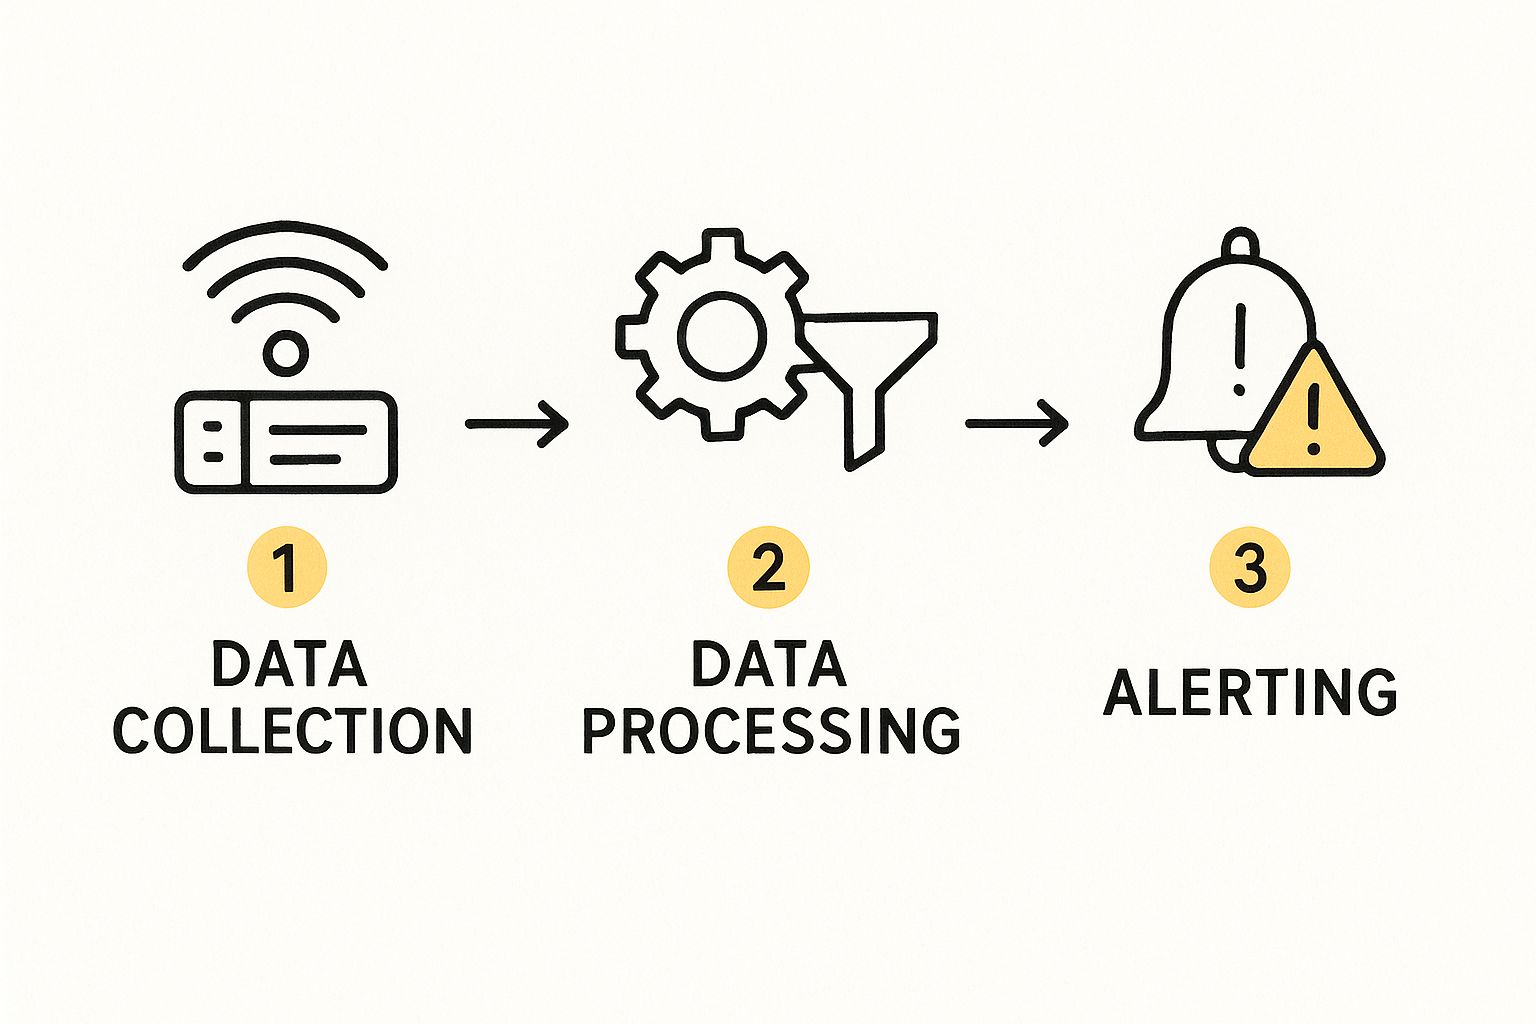
Ultimately, the goal is to transform a high-volume stream of raw inputs into intelligent, useful outputs that drive operational action.
Analysis And Alerting Engine
The final layers are where data is transformed into insight. The analysis and visualization layer connects to the TSDB, enabling engineers to execute complex queries (e.g., using PromQL) and construct dashboards. These dashboards utilize graphs, heatmaps, and stat panels to translate vast amounts of performance data into a human-readable format for at-a-glance analysis.
Running in parallel is the alerting and notification engine. This component continuously evaluates the incoming data stream against predefined rules.
An alerting rule is a logical expression that defines a failure condition. For example, a PromQL rule might be
avg_over_time(node_load1[5m]) > 0.8 * count(node_cpu_seconds_total) without (cpu, mode). This rule triggers an alert if the 5-minute average server load exceeds 80% of its CPU core count.
When a condition is met, the engine triggers a notification, routing it to the appropriate teams via integrations with services like Slack, PagerDuty, or OpsGenie. Key components of this engine include:
- Thresholds: Static or dynamic numerical limits that define normal operating parameters.
- Anomaly Detection: Machine learning algorithms that establish a baseline of normal behavior and can detect statistically significant deviations, catching issues that static thresholds would miss.
- Routing Rules: The logic that directs specific alerts to the correct on-call personnel based on labels, severity, or service ownership (e.g.,
team=databasealerts route to the DBA PagerDuty schedule).
Key Metrics You Must Track for Optimal Performance
Effective infrastructure monitoring is not about collecting every possible metric; it is about focusing on the specific signals that accurately reflect system health and user experience. Being overwhelmed by low-signal data is as detrimental as having no data at all.
To achieve true visibility, you must track specific, actionable metrics. These are the quantitative measurements that provide a clear view into component behavior, particularly under load.
We can categorize these into three critical domains: servers (compute), networks, and applications. This layered approach provides a structured methodology for analyzing the entire stack, from the physical hardware or hypervisor up to the end-user interaction.

Core Server Metrics
Your servers represent the foundational compute layer. Their core resources—CPU, memory, and disk—are the primary indicators of system health. These metrics answer a fundamental question: does the hardware have sufficient capacity to handle the current workload?
- CPU Utilization: The percentage of time the CPU is not in an idle state. Consistently high utilization (e.g., >80%) indicates the server is overloaded, leading to increased processing latency for all running applications.
- Memory Usage: The amount of physical RAM being consumed. When available memory is exhausted, the operating system resorts to "swapping" memory pages to disk, which is orders of magnitude slower and can severely degrade application performance.
- Disk I/O (Input/Output): Monitors the rate of read/write operations and the latency of those operations. High disk I/O wait times can create a bottleneck for the entire application, particularly for database-intensive workloads.
Essential Network Metrics
The network is the connective tissue of your infrastructure. Even with perfectly healthy servers and applications, network degradation can render services slow or completely unavailable to users.
Key metrics to monitor include:
- Latency: The round-trip time (RTT) for a packet to travel from source to destination and back. For end-users, high latency manifests directly as slow page loads or API responses.
- Packet Loss: The percentage of data packets that are lost in transit across the network. Even a small amount of packet loss (1-2%) can have a catastrophic impact on TCP-based applications, causing retransmissions and severely reducing throughput.
- Bandwidth Utilization: The current data transfer rate as a percentage of the network interface's maximum capacity. Sustained high utilization can lead to network congestion, queuing delays, and dropped packets.
A powerful mental model for this is Google's "Four Golden Signals" framework from their SRE handbook. It advocates focusing on Latency, Traffic, Errors, and Saturation. These four signals provide the most critical indicators of service health without creating excessive noise.
Application Performance Metrics (APM)
Finally, APM metrics bridge the gap between infrastructure health and the actual user experience. They measure the performance of the application code itself and are directly tied to business outcomes.
- Response Time: The total duration from when an application receives a request to when it completes its response. This is arguably the most critical indicator of user-perceived performance.
- Error Rate: The percentage of incoming requests that result in an error, typically measured by HTTP status codes (e.g., 5xx server errors). A sudden increase in the error rate is a clear indicator of a production issue.
Once you’ve instrumented your code to collect the right metrics, they must be visualized. A well-designed dashboard is essential for rapid analysis and incident detection. To learn more, you can explore how to create a KPI dashboard that enables your team to spot trends and anomalies effectively.
To consolidate this information, here is a reference table of essential infrastructure monitoring metrics.
Essential Infrastructure Monitoring Metrics
| Category | Metric | Why It's Important | Example 'Warning' Threshold |
|---|---|---|---|
| Server | CPU Utilization | Indicates if the server is overloaded. High CPU leads to slow processing and delays for all applications running on it. | Consistently > 80% |
| Server | Memory Usage | Shows if the server has enough RAM. When memory is full, the system resorts to slow disk "swapping," which kills performance. | Consistently > 90% |
| Server | Disk I/O Wait Time | Measures the time the CPU waits for disk operations. High wait times mean storage is a bottleneck, slowing down data access. | > 20ms |
| Network | Latency | The delay in data transmission. High latency directly translates to a slow and frustrating user experience. | > 100ms for web apps |
| Network | Packet Loss | Percentage of data packets lost during transit. Even low packet loss can break real-time applications and cause data corruption. | > 1% |
| Network | Bandwidth Utilization | Tracks how much network capacity is being used. Maxed-out bandwidth creates a traffic jam for all services. | Consistently > 85% |
| Application | Response Time (Latency) | The total time to fulfill a user request. This is the primary measure of user-perceived performance. | > 500ms average |
| Application | Error Rate | The percentage of requests that result in an error (e.g., HTTP 5xx). A spike is a clear signal that something is broken. | > 2% of requests |
Establishing intelligent thresholds is the first step. The ultimate goal is to build a deep understanding of your systems' baseline performance characteristics to enable rapid detection of anomalous behavior before it impacts users.
How to Choose the Right Infrastructure Monitoring Tools
Selecting the right infrastructure monitoring tool is a critical engineering decision. The right choice empowers your team with proactive insights and operational efficiency. The wrong choice leads to alert fatigue, slow troubleshooting, and a tool that engineers actively avoid.
The market is saturated with options, from powerful open-source projects to comprehensive commercial platforms. The decision can be simplified by evaluating options against a clear set of technical criteria.
The primary decision point is often between open-source software and a commercial Software-as-a-Service (SaaS) platform. Each approach presents significant trade-offs regarding cost, flexibility, and operational overhead. The optimal choice depends entirely on your team's technical expertise, budget, and long-term scalability requirements.
Open-Source vs Commercial SaaS Platforms
Open-source tools like Prometheus and Zabbix offer maximum flexibility and control. They are free to use, highly extensible, and supported by large, active communities.
However, this control comes at the cost of engineering time. Your team is responsible for the entire lifecycle of the monitoring platform: initial deployment, configuration, scaling, high availability, and long-term data storage. In a growing organization, this can easily become a full-time responsibility for a dedicated team of engineers.
Conversely, commercial SaaS platforms like Datadog and New Relic provide managed, all-in-one solutions. They offer polished user interfaces, extensive libraries of pre-built integrations, and enterprise-level support. This allows your engineers to focus on using the data for problem-solving rather than managing the monitoring tool itself.
The primary disadvantage is the cost structure. Pricing models are often based on data ingestion volume, host count, or custom metrics, which can become substantial in large-scale environments.
The right tool isn't just about features; it's about total cost of ownership (TCO). When comparing options, factor in the engineering headcount and salary costs required to manage an open-source solution versus the subscription fees for a commercial platform to understand the true financial impact.
Key Technical Criteria for Evaluation
To make an informed decision, evaluate each potential tool against a consistent set of technical requirements. This ensures a fair comparison and helps you select a solution that meets your specific operational needs.
Here is a checklist of critical questions to ask during the evaluation process:
- Scalability & High Availability: Can this tool scale to handle our projected data ingestion rate over the next 3-5 years? What is its high-availability architecture? How does it handle data replication and failover?
- Integration Ecosystem: Does it provide out-of-the-box integrations for our core technology stack (e.g., Kubernetes, AWS services, PostgreSQL, Kafka)? For our custom applications, what are the available SDKs and APIs for instrumentation?
- Feature Depth (The Three Pillars): Does the platform unify metrics, logs, and traces into a single, correlated view to enable true observability? Does it support advanced features like Application Performance Monitoring (APM), Real User Monitoring (RUM), and synthetic monitoring?
- Cost Model: Is the pricing based on hosts, data ingestion per GB, users, or a combination? What are the potential hidden costs associated with long-term data retention, custom metric cardinality, or premium support tiers?
- Alerting and Automation: How sophisticated is the alerting engine? Can we define multi-condition, composite alerts to reduce false positives? Does it offer integrations with our incident management and automation tools (e.g., PagerDuty, Ansible Tower)?
The objective is to find the optimal balance between technical capability, usability, and cost. Real-time data visibility is non-negotiable for operating reliable systems. For a deeper dive, explore our guide on what is continuous monitoring and its role in a modern DevOps practice.
Putting Your Monitoring Strategy Into Action
A powerful monitoring tool is only effective when supported by a well-defined strategy. Real value is derived from a deliberate implementation that integrates monitoring into the daily workflows and culture of your engineering organization.
The first principle of a modern strategy is to eliminate manual configuration. This is where monitoring-as-code becomes a critical practice. By defining dashboards, alert rules, and data collection configurations in version-controlled text files (e.g., YAML, Terraform HCL), your entire monitoring setup becomes repeatable, auditable, and transparent. Monitoring configurations are treated like application code—they are subject to peer review, automated testing, and CI/CD deployment.
For organizations that prefer to offload the management of their operational technology, partnering with managed IT infrastructure solutions can provide the necessary expertise and execution.
Designing for People, Not Just Machines
A common pitfall is creating a monolithic, one-size-fits-all monitoring view. This approach is ineffective. Different roles have distinct needs, and your strategy must cater to them by creating role-based dashboards and alert policies:
- SREs and DevOps Teams: Require high-density, real-time dashboards focused on service-level objectives (SLOs), error budgets, resource saturation, and system-level performance indicators.
- Developers: Need application-centric dashboards displaying APM data, such as transaction traces, database query latency, and error rates for the specific microservices they own.
- Business Stakeholders: Require high-level views that abstract away technical complexity. These dashboards should display key performance indicators (KPIs) like service uptime, user experience scores (Apdex), and conversion funnels.
This tailored approach ensures that all stakeholders receive relevant, actionable information, transforming monitoring from a niche engineering tool into a shared source of truth for the entire organization.
The ultimate goal is not just data collection; it's creating a high-velocity feedback loop. By integrating monitoring data directly into your CI/CD pipeline, you can perform automated performance testing and immediately detect regressions with each new deployment. This enables faster, safer, and data-informed releases.
Scaling and Refining Your Strategy
It is crucial to start small and iterate. Do not attempt to monitor every component of your infrastructure from day one. Begin by instrumenting your most critical services, establishing performance baselines, and then methodically expanding coverage. This iterative process allows you to fine-tune alert thresholds and dashboard designs based on real-world operational data.
Market data supports this strategic imperative. The global infrastructure monitoring sector was valued at USD 5.59 billion in 2024 and is projected to expand to USD 15.70 billion by 2034. This explosive growth reflects the increasing importance of reliable and secure digital infrastructure worldwide. You can explore more of these market trends on Precedence Research. As your infrastructure scales in complexity, your monitoring strategy must evolve in parallel to adapt to new technologies and increased data volume.
The Future of Infrastructure Monitoring: AIOps and Observability
The field of infrastructure monitoring is undergoing a significant paradigm shift. Traditional methods relying on static thresholds and manual log analysis are insufficient for managing the scale and complexity of modern, distributed systems. The future is defined by two major trends that make monitoring more intelligent and effective: AIOps and observability.
AIOps (AI for IT Operations) integrates machine learning and data science into the monitoring workflow. It applies advanced algorithms to the massive streams of telemetry data generated by your systems. Instead of reacting to predefined alert conditions, AIOps platforms learn the normal operational baseline of your specific environment.
This enables the system to detect subtle anomalies and correlate disparate events across the stack that a human engineer might miss. For example, AIOps can automatically link a spike in application latency to a specific database query slowdown and an underlying increase in disk I/O wait time, pinpointing the root cause in seconds. The goal is to shift from reactive firefighting to a proactive, and often automated, problem-resolution model.
The Rise of Observability
If traditional monitoring tells you that a system is broken, observability is the practice that enables you to understand why. This is not merely a new marketing term; it is a fundamental evolution required for debugging complex, ephemeral systems like microservices and serverless architectures.
Observability is built upon the "three pillars"—metrics, logs, and traces—but its true power lies in the ability to ask arbitrary, exploratory questions about your system's state without having to pre-define a metric or dashboard. It is the toolkit for investigating "unknown unknowns."
In today's dynamic, containerized environments, you cannot possibly anticipate every potential failure mode. Observability provides the high-cardinality data and analytical tools necessary to explore system behavior in real-time, making it possible to debug novel issues you have never encountered before.
This shift towards more intelligent, exploratory tools is transformative. It aligns perfectly with the principles of automation, which is why understanding the benefits of Infrastructure as Code is essential for any modern engineering team. By embracing both AIOps and observability, organizations can build systems that are not just monitored, but are deeply understood and inherently resilient.
Even with a solid strategy in place, several technical questions frequently arise during implementation. Let's address some of the most common queries from engineers and IT leaders.
What’s the Real Difference Between Monitoring and Observability?
This distinction is a common point of confusion, but it is critical to understand.
Monitoring is the practice of collecting and analyzing data based on a predefined set of metrics and failure modes. It is about asking known questions, such as "What is the current CPU utilization?" or "Is our web server responding to requests?"
Observability, conversely, is a property of a system. It describes the ability to infer a system's internal state from its external outputs (telemetry). It enables you to ask questions you didn't know you needed to ask, allowing for the exploration of unknown failure modes.
Analogy: Monitoring tells you that a patient has a fever. Observability gives you the diagnostic tools (rich telemetry) to investigate why they have a fever, even if the underlying cause is a novel pathogen you've never seen before.
How Do I Actually Stop Alert Fatigue?
Alert fatigue, where on-call engineers become desensitized to a constant stream of low-signal notifications, is a serious threat to operational stability. Combating it requires making alerts meaningful and actionable.
- Make it Actionable: Every alert that triggers a page should require immediate human intervention. If it's something that can wait until business hours, it should be a ticket or an email, not a page.
- Use Severity Tiers: Implement a clear alert severity hierarchy (e.g., P1/Critical, P2/Warning, P3/Info). A 95% CPU saturation on a critical production database at 3 AM is a P1. A 70% spike on a non-critical batch processing server is a P2 at best.
- Group and Correlate: Utilize monitoring tools that can group related alerts from a single cascading failure into one consolidated incident. This provides context instead of overwhelming the on-call engineer with dozens of individual notifications.
What’s Better: Agent-Based or Agentless Monitoring?
This question concerns the data collection methodology. There are two primary approaches, and most modern monitoring strategies employ a hybrid model.
Agent-based monitoring involves installing a dedicated software agent on each host or in each container. This agent has privileged access to the system kernel and application processes, enabling it to collect extremely detailed, high-resolution telemetry that is inaccessible remotely. This includes application performance traces, custom business metrics, and granular system-level data.
Agentless monitoring collects data remotely by querying APIs (e.g., the AWS CloudWatch API) or using standard network protocols like SNMP (Simple Network Management Protocol) or WMI (Windows Management Instrumentation). This approach is often faster to deploy as it requires no software installation on the target hosts. However, the data collected is typically less granular and may have higher latency. It is ideal for network devices, cloud provider services, and systems where agent installation is not feasible.
Ready to build a monitoring strategy that actually works, with people who've done it a thousand times before? OpsMoon connects you with the top 0.7% of remote DevOps engineers who can build, automate, and manage your infrastructure right. Start with a free work planning session and find the talent you need to make your systems bulletproof.