Top 12 Best Infrastructure Monitoring Tools for 2025
 By opsmoon
Discover the best infrastructure monitoring tools in 2025 to optimize your IT operations. Learn about the top solutions and choose the right one for you!
In today's complex, multi-cloud environments, infrastructure monitoring is no longer a luxury—it's the foundation of reliability engineering and high-performance operations. With countless platforms on the market, each promising total visibility, selecting the right one is a critical engineering decision. This guide moves beyond generic marketing claims to provide a deeply technical and actionable breakdown of the 12 best infrastructure monitoring tools for today's demanding workloads.
We will dissect the core architecture of each solution, from agent-based models that run on your hosts to agentless collectors that use APIs and protocols like SNMP. We will also analyze pricing structures down to the per-unit cost for hosts, containers, custom metrics, and data ingest/retention policies. For each platform, you'll find a detailed analysis covering:
- Key Features: A technical look at capabilities like distributed tracing implementation (e.g., OpenTelemetry vs. proprietary agents), log management query languages, and AIOps for automated root cause analysis.
- Ideal Use Cases: Specific scenarios where each tool excels, such as high-cardinality metric analysis in Kubernetes observability or serverless function monitoring with cold start detection.
- Practical Limitations: An honest assessment of potential drawbacks, from the performance overhead of certain agents to vendor lock-in risks associated with proprietary data formats.
Whether you're an SRE managing bare-metal servers with Ansible, a DevOps lead orchestrating complex Kubernetes clusters with ArgoCD, or a CTO evaluating scalable solutions with predictable cost models, this in-depth comparison is designed to help you make an informed, data-driven choice. Each entry includes direct links and representative screenshots to clarify functionality, enabling you to build the most effective monitoring stack for your specific technical and budgetary needs.
1. Datadog
Datadog is a comprehensive, full-stack observability platform renowned for its extensive integration library and powerful analytics engine. It stands out by unifying metrics, traces, and logs from your entire stack into a single SaaS solution, making it one of the best infrastructure monitoring tools for teams needing a consolidated view without managing disparate backends. Its architecture relies on a lightweight, unified agent that collects data locally and forwards it to the Datadog backend, minimizing network overhead.
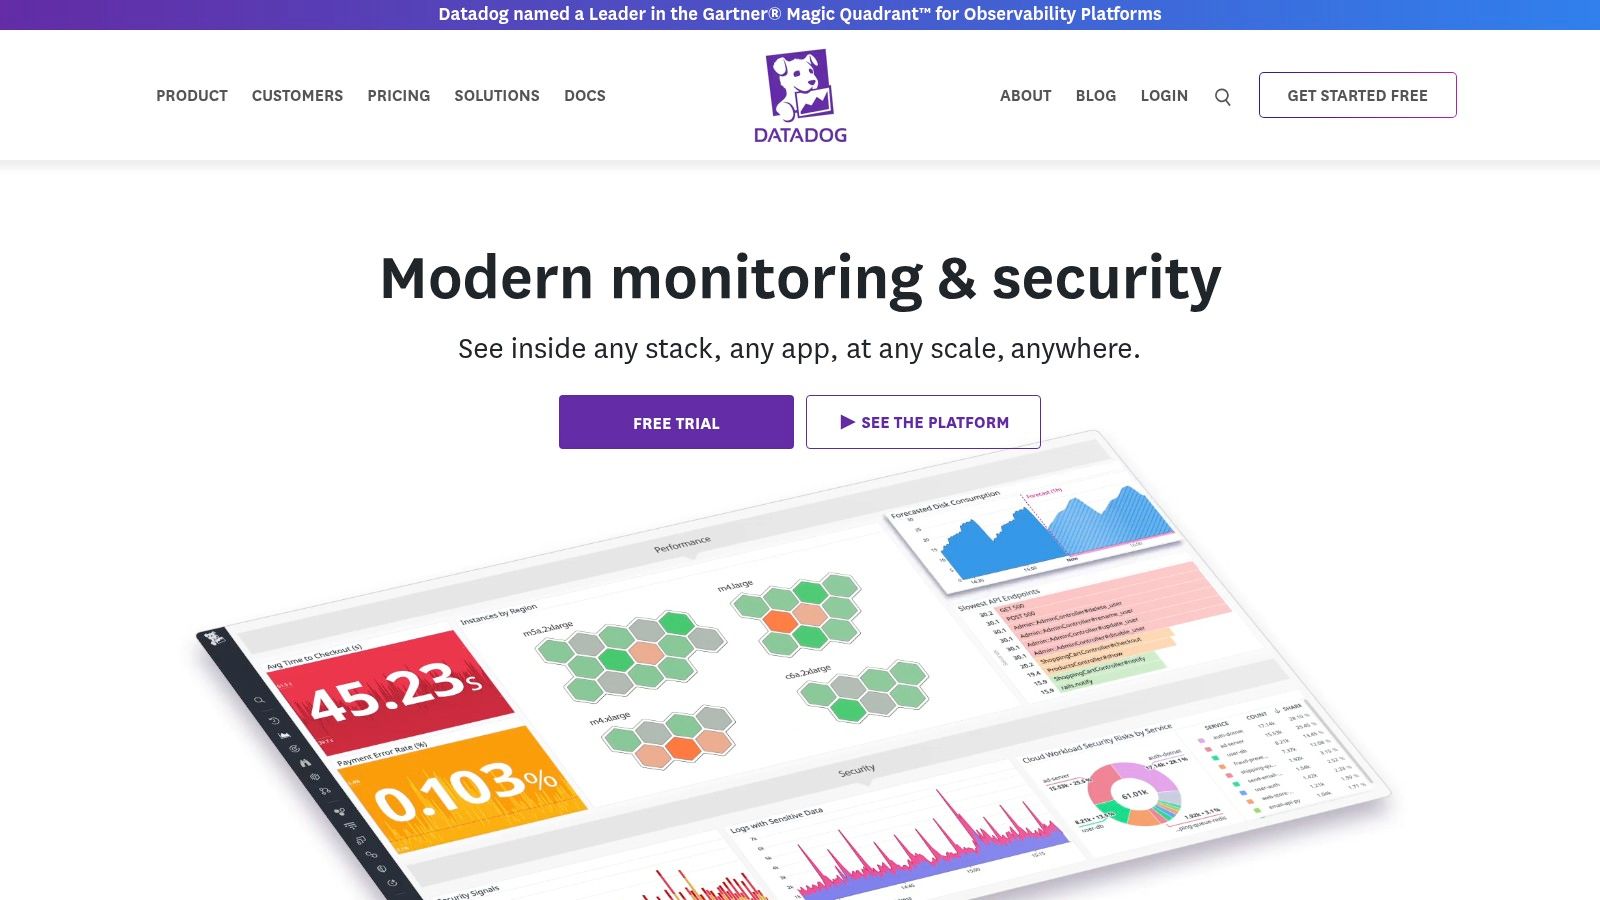
The agent-based data collection is simple to deploy via package managers, Docker containers, or as a DaemonSet in Kubernetes. A key advantage is its modular pricing, which allows you to enable specific products like Infrastructure Monitoring, APM, or Log Management. However, this flexibility can lead to unpredictable costs, as custom metrics, ingested log volumes, and APM host counts are all billed separately. For a deeper understanding of the core concepts, you can find a comprehensive guide on what infrastructure monitoring is.
Key Information
- Best For: Enterprises and engineering teams needing a unified, all-in-one observability platform with deep integration support for both modern and legacy systems.
- Pricing: Modular, based on usage (e.g., per host, per GB of logs, custom metric counts). A free tier is available for basic monitoring of up to 5 hosts.
- Pros: Over 900 integrations, highly customizable dashboards with advanced query capabilities, and a mature feature set covering the full observability spectrum.
- Cons: Can become expensive quickly, especially with high-cardinality custom metrics; the sheer number of features can present a steep learning curve.
- Website: https://www.datadoghq.com
2. New Relic
New Relic offers a powerful, all-in-one observability platform that simplifies how teams monitor their entire technology stack. It stands out by consolidating all telemetry data—metrics, events, logs, and traces (MELT)—into a single time-series database (NRDB), which allows for powerful querying and correlation using its SQL-like query language, NRQL. This unified backend makes it one of the best infrastructure monitoring tools for organizations looking to break down data silos and perform complex cross-domain analysis.
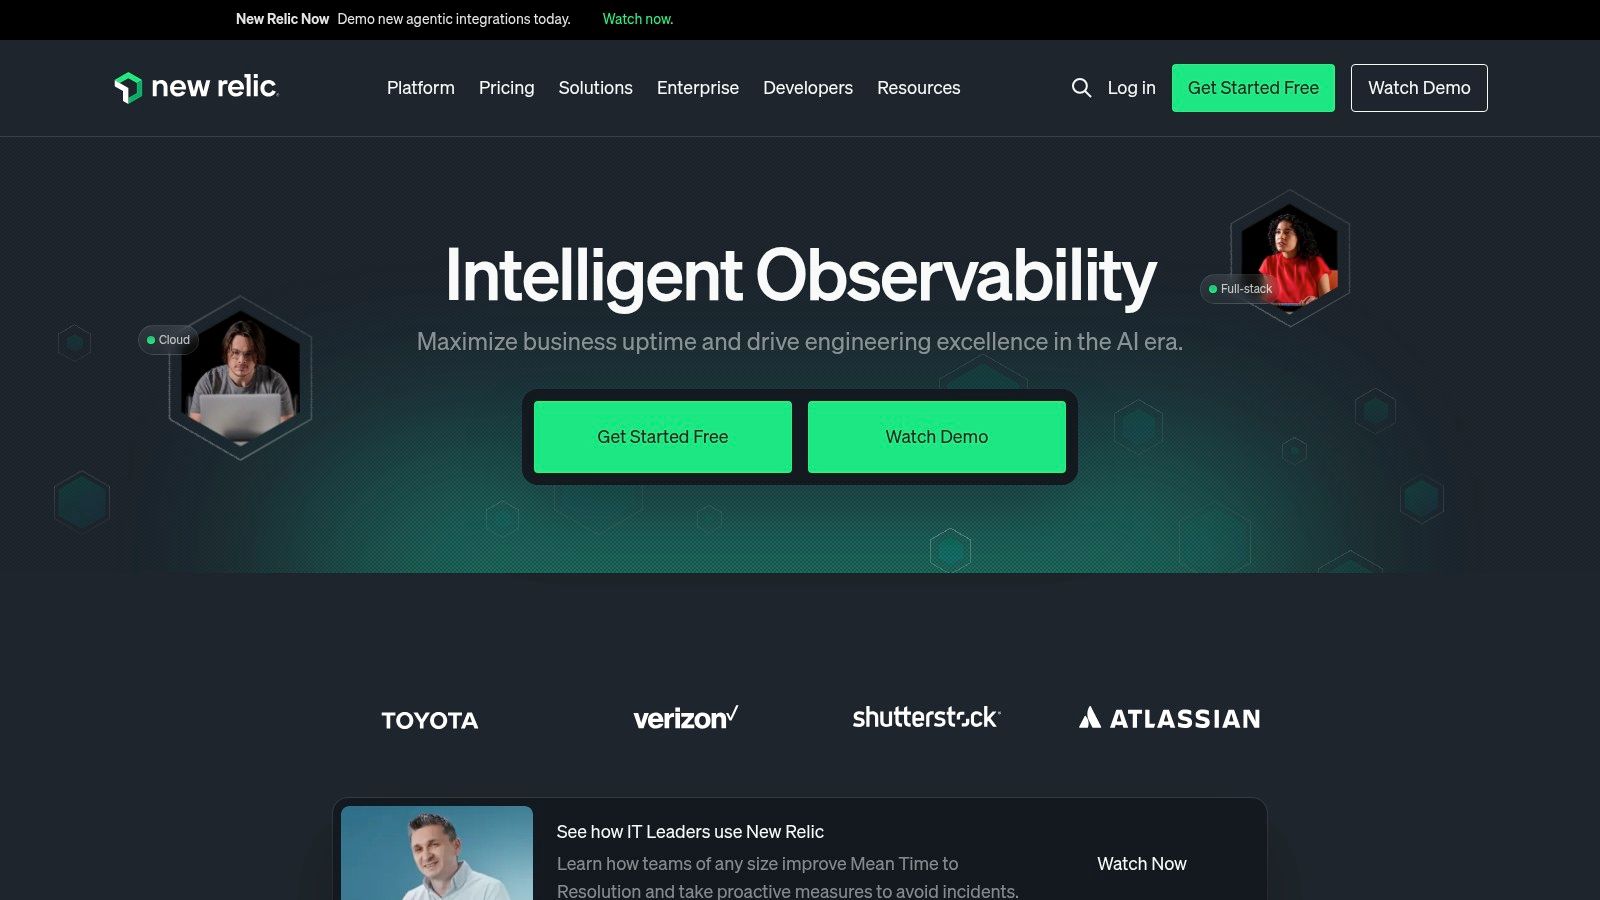
The platform is built with a strong emphasis on open standards, offering native OpenTelemetry support and extensive integrations to ensure easy data ingestion from any source via its Telemetry Data Platform. A key differentiator is its transparent, usage-based pricing model, which charges based on data ingest (per GB) and per-user fees, simplifying cost management. For organizations with strict compliance needs, the Data Plus offering provides enhanced security, governance, and availability features, including FedRAMP and HIPAA eligibility, making it suitable for highly regulated industries.
Key Information
- Best For: Teams of all sizes seeking a simplified, usage-based pricing model with a generous free tier and strong compliance capabilities for regulated workloads.
- Pricing: Usage-based pricing based on data ingest (GB) and users. A perpetual free tier includes 100 GB of data ingest per month.
- Pros: Simple onboarding and a generous free tier, transparent and predictable pricing model, strong governance and compliance offerings via Data Plus.
- Cons: Costs can become unpredictable with high or spiky data volumes; some advanced features like high-performance querying are locked behind higher-tier plans.
- Website: https://newrelic.com
3. Dynatrace
Dynatrace offers an enterprise-grade, all-in-one observability platform heavily focused on automation and AI-powered answers. Its core strength lies in the Davis AI engine, which moves beyond simple correlation-based alerting to provide deterministic, topology-aware root cause analysis. This makes it one of the best infrastructure monitoring tools for teams looking to minimize manual troubleshooting and reduce mean time to resolution (MTTR) in complex, dynamic environments like Kubernetes and microservices.
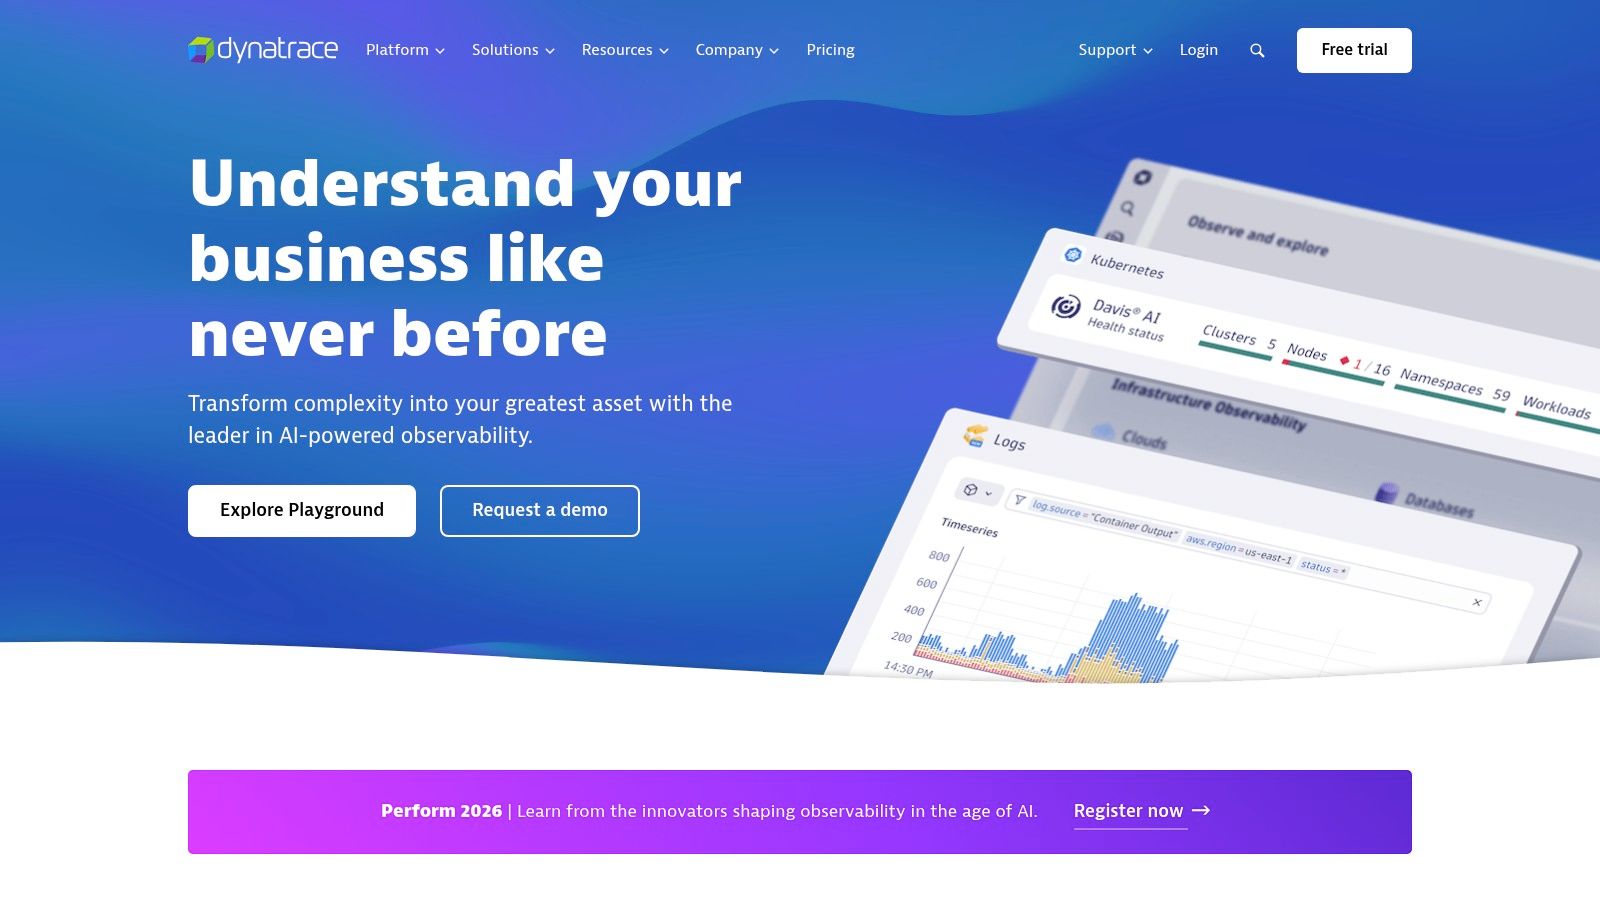
Deployment is streamlined through its OneAgent technology, a single binary that automatically discovers and instruments all components of your technology stack, from infrastructure hosts and processes to services and front-end applications, using bytecode injection and other techniques. This approach significantly simplifies setup and ensures comprehensive data collection with minimal configuration. Dynatrace's unique pricing, based on hourly usage for different monitoring tiers (e.g., Host Units, DEM Units), offers flexibility but requires careful management to control costs in large-scale, elastic deployments.
Key Information
- Best For: Large enterprises and DevOps teams that require deep, automated root cause analysis and have complex, cloud-native environments demanding high-fidelity data.
- Pricing: Based on hourly usage across various modules like Full-stack Monitoring, Infrastructure Monitoring, and Application Security.
- Pros: Powerful AI-driven diagnostics with Davis, simplified deployment via OneAgent, and robust auto-discovery and real-time topology mapping (Smartscape).
- Cons: Premium pricing can be prohibitive for smaller teams; the platform's depth and complexity can present a significant learning curve.
- Website: https://www.dynatrace.com
4. Grafana Cloud
Grafana Cloud offers a fully managed observability stack built around the popular open-source Grafana visualization tool. It bundles hosted metrics (Prometheus and Graphite), logs (Loki), and traces (Tempo) into a cohesive platform, making it one of the best infrastructure monitoring tools for teams committed to open standards and avoiding vendor lock-in. This approach allows organizations to leverage powerful, community-driven technologies without managing the underlying infrastructure for storage, replication, and high availability.
The platform is particularly strong for those already using Prometheus or seeking to adopt OpenTelemetry, as it provides a seamless, managed backend that is fully API-compatible. Its pay-as-you-go pricing model is granular, billed on distinct units like active series for metrics, log gigabytes ingested and stored, and trace gigabytes. While this offers flexibility and a generous free tier, it requires careful monitoring of usage—especially metric cardinality—to manage costs effectively as systems scale. The detailed documentation on billing helps teams forecast and control their observability spend.
Key Information
- Best For: Teams that favor open-source standards like Prometheus and OpenTelemetry and need a managed, scalable platform for visualization and alerting.
- Pricing: Pay-as-you-go based on data usage (metrics, logs, traces). A generous "Free Forever" tier is available with usage limits.
- Pros: Excellent support for open standards, a powerful and generous free tier, transparent and flexible pricing model that scales with usage.
- Cons: Managing multiple pricing units (series, logs, traces) can be complex; advanced enterprise features like SSO and reporting often require annual commitments.
- Website: https://grafana.com
5. Elastic Observability (Elastic Cloud, Serverless)
Elastic Observability leverages the powerful search and analytics foundation of the Elastic Stack (Elasticsearch, Logstash, Kibana) to deliver comprehensive infrastructure monitoring. It excels at unifying logs, metrics, and traces, offering deep visibility into complex, multi-cloud environments. Its primary strength lies in its exceptional data correlation and root cause analysis capabilities powered by Elasticsearch's indexing engine, making it one of the best infrastructure monitoring tools for teams that prioritize rapid, data-driven troubleshooting and forensic analysis.
Delivered via Elastic Cloud, its serverless architecture simplifies deployment across AWS, Azure, and GCP, removing operational overhead associated with managing an Elasticsearch cluster. A key technical advantage is its fine-grained, per-GB pricing for data ingest and retention, which provides cost predictability. However, this model necessitates disciplined data hygiene and effective use of index lifecycle management (ILM) policies to tier data to less expensive storage or delete it, preventing costs from escalating. The platform also offers advanced features like an AI assistant and managed synthetics as optional add-ons.
Key Information
- Best For: Teams needing powerful log analytics and search capabilities integrated with their infrastructure metrics and traces, particularly those already familiar with the ELK stack.
- Pricing: Serverless, usage-based pricing determined by per-GB data ingest and retention, with different tiers for features.
- Pros: Competitive and granular pricing for ingest and retention, powerful search capabilities via Kibana Query Language (KQL), and AI-enhanced operational workflows.
- Cons: Per-GB pricing requires careful data management and ILM policies to control costs; some advanced AIOps features are locked behind higher-tier plans.
- Website: https://www.elastic.co
6. Splunk Observability Cloud
Splunk Observability Cloud is a comprehensive SaaS suite designed for real-time, end-to-end visibility across hybrid and multi-cloud environments. It stands apart with its powerful stream-processing architecture, allowing for immediate analysis and alerting on metrics, traces, and logs as they are ingested—before they are indexed. This makes it one of the best infrastructure monitoring tools for teams that require high-fidelity, no-sample monitoring and rapid root cause analysis in complex, distributed systems.
The platform’s strength lies in its native support for OpenTelemetry, ensuring vendor-neutral data collection and simplified instrumentation across diverse technology stacks. It combines infrastructure monitoring, APM, real user monitoring, and log management into an integrated solution with built-in incident response workflows. To explore how such integrated systems function, you can learn more about observability services. While its tiered, host-based pricing is straightforward, it can be less cost-effective for highly elastic, containerized workloads compared to usage-based models.
Key Information
- Best For: Organizations requiring real-time streaming analytics and full-fidelity data processing without sampling, especially those heavily invested in OpenTelemetry.
- Pricing: Edition-based, with infrastructure monitoring starting from $15 per host/month. Free trials are available for different editions.
- Pros: Mature, real-time analytics capability; comprehensive feature set across all monitoring domains; clear pricing tiers and native OpenTelemetry support.
- Cons: Host-based pricing may be less cost-effective for bursty, auto-scaling container workloads; advanced features are locked into higher-priced editions.
- Website: https://www.splunk.com
7. SolarWinds
SolarWinds offers a powerful suite of observability and monitoring solutions catering to both traditional on-premises infrastructures and modern hybrid cloud environments. It stands out by providing both a comprehensive SaaS platform, SolarWinds Observability, and a set of well-established self-hosted tools like the Network Performance Monitor (NPM) and Server & Application Monitor (SAM). This flexibility makes SolarWinds one of the best infrastructure monitoring tools for organizations transitioning to the cloud or requiring deep, device-centric visibility into their existing network hardware using protocols like SNMP, WMI, and ICMP.
The platform is known for its strong SNMP-based monitoring, providing granular detail on network devices, servers, and applications. Many network and systems administrators are already familiar with its Orion-based ecosystem, which can reduce the learning curve. While its modular pricing allows you to build a tailored solution, it requires careful planning to manage costs as you add capabilities like network traffic analysis or configuration management. The self-hosted options offer greater control over data sovereignty but demand more initial setup and maintenance compared to pure SaaS alternatives.
Key Information
- Best For: IT departments in mid-to-large enterprises with hybrid or on-premises environments needing robust network and server monitoring.
- Pricing: Modular, with both perpetual licenses for self-hosted products and subscription plans for its SaaS offering.
- Pros: Strong SNMP-based and device-centric monitoring capabilities, familiar toolset for many IT professionals, large existing ecosystem and user base.
- Cons: Modular pricing can become costly when expanding capabilities; requires more setup effort and infrastructure management compared to cloud-native SaaS.
- Website: https://www.solarwinds.com
8. Zabbix
Zabbix is a mature, enterprise-grade open-source infrastructure monitoring solution offering a powerful and cost-effective alternative to commercial SaaS products. It provides comprehensive monitoring for servers (Linux, Windows), networks, cloud services, and applications from a self-hosted platform. The primary appeal of Zabbix lies in its complete freedom from licensing fees, allowing organizations to monitor an unlimited number of devices and metrics without incurring escalating software costs, making it one of the best infrastructure monitoring tools for budget-conscious teams with the requisite technical skills.
The platform's strength is its high degree of customizability, supported by a rich templating system and powerful low-level discovery (LLD) features that can automatically find and start monitoring network devices, filesystems, and other resources. Zabbix can use both agent-based and agentless (e.g., SNMP, IPMI) collection methods. While the software itself is free, Zabbix offers paid technical support tiers with defined SLAs for enterprises that require guaranteed assistance. This model provides the flexibility of open-source with the reliability of commercial support, though it places the burden of hosting, scaling, and maintaining the backend database on the user's team.
Key Information
- Best For: Organizations with in-house technical expertise seeking a highly customizable, no-cost monitoring solution they can fully control.
- Pricing: Free and open-source software. Optional paid enterprise support plans are available via custom quote.
- Pros: No licensing costs for unlimited devices, highly customizable platform with strong community support, and optional enterprise-level support with SLAs.
- Cons: Requires self-hosting and significant ongoing maintenance of the Zabbix server and backend database; obtaining pricing for support requires a direct sales inquiry.
- Website: https://www.zabbix.com
9. Prometheus (Official Project)
Prometheus is the cornerstone of modern, open-source monitoring, particularly within cloud-native and Kubernetes ecosystems. As a CNCF-graduated project, it provides a powerful, metrics-based time-series database (TSDB) and a flexible query language called PromQL. It operates on a pull-based model, where the Prometheus server scrapes metrics from HTTP endpoints on configured targets, making it highly resilient and straightforward to manage in dynamic environments with service discovery. Its vendor-neutral approach and extensive ecosystem of exporters make it one of the best infrastructure monitoring tools for teams wanting ultimate control and customization.
While the official project provides the core components (server, Alertmanager, client libraries), a production implementation requires self-management of long-term storage (e.g., via Thanos or Cortex), high availability, and scaling. Prometheus excels at collecting numerical metrics but is not designed for logging or tracing, which requires integrating separate tools like Loki and Jaeger to complete the observability triad. For teams looking to leverage this powerful system without the operational overhead, various managed services and expert support are available. If you're considering this tool, you can get help with Prometheus consulting and implementation to streamline your setup.
Key Information
- Best For: Organizations committed to an open-source, cloud-native stack that require a highly customizable and scalable metrics-based monitoring solution.
- Pricing: Completely free and open-source. Costs are associated with the underlying infrastructure (compute, storage) and operational management.
- Pros: Zero licensing cost and highly flexible, extensive community and comprehensive documentation, foundation for most modern monitoring stacks.
- Cons: Users must manage scaling, long-term storage, and high availability themselves; focused on metrics, requiring separate tools for logs and traces.
- Website: https://prometheus.io
10. AWS Marketplace (Observability & Monitoring)
For teams deeply embedded in the AWS ecosystem, the AWS Marketplace offers a streamlined and integrated way to procure and deploy some of the best infrastructure monitoring tools. Instead of being a single tool, it’s a digital catalog that centralizes thousands of software listings, including top-tier observability platforms like New Relic, Grafana Cloud, and LogicMonitor. Its primary advantage is simplifying the procurement and billing process, consolidating all software costs into a single AWS bill and allowing spend to count towards enterprise discount commitments.
This approach is highly efficient for organizations that want to leverage their existing AWS Enterprise Discount Program (EDP) commitments for third-party software purchases. Deployment is often simplified with one-click options via CloudFormation templates, reducing setup friction and ensuring resources are provisioned according to best practices. While it provides immense variety, the marketplace itself can be complex to navigate, and not all listings offer transparent, pay-as-you-go pricing, sometimes requiring direct contact with the vendor for a private offer tailored to your usage.
Key Information
- Best For: Organizations heavily invested in AWS seeking simplified procurement, consolidated billing, and quick deployment of third-party monitoring tools.
- Pricing: Varies by vendor; many offer pay-as-you-go, annual subscriptions, and free trials. Billing is integrated with your AWS account.
- Pros: Centralized procurement and billing, wide selection of leading tools, leverages existing AWS agreements (EDP), and simplifies deployment via CloudFormation.
- Cons: Pricing is not always transparent, and navigating the vast catalog to find the right tool can be challenging.
- Website: https://aws.amazon.com/marketplace/solutions/devops/observability-and-monitoring
11. Microsoft Azure Marketplace (Monitoring & Diagnostics)
For organizations heavily invested in the Microsoft Azure ecosystem, the Azure Marketplace serves as a centralized hub for discovering and deploying some of the best infrastructure monitoring tools. Rather than a single product, it is a curated catalog of first-party (e.g., Azure Monitor) and third-party observability solutions, including prominent names like Datadog, Dynatrace, and Grafana. This streamlines procurement and deployment by integrating directly with Azure subscriptions and billing, simplifying vendor management and cost allocation.
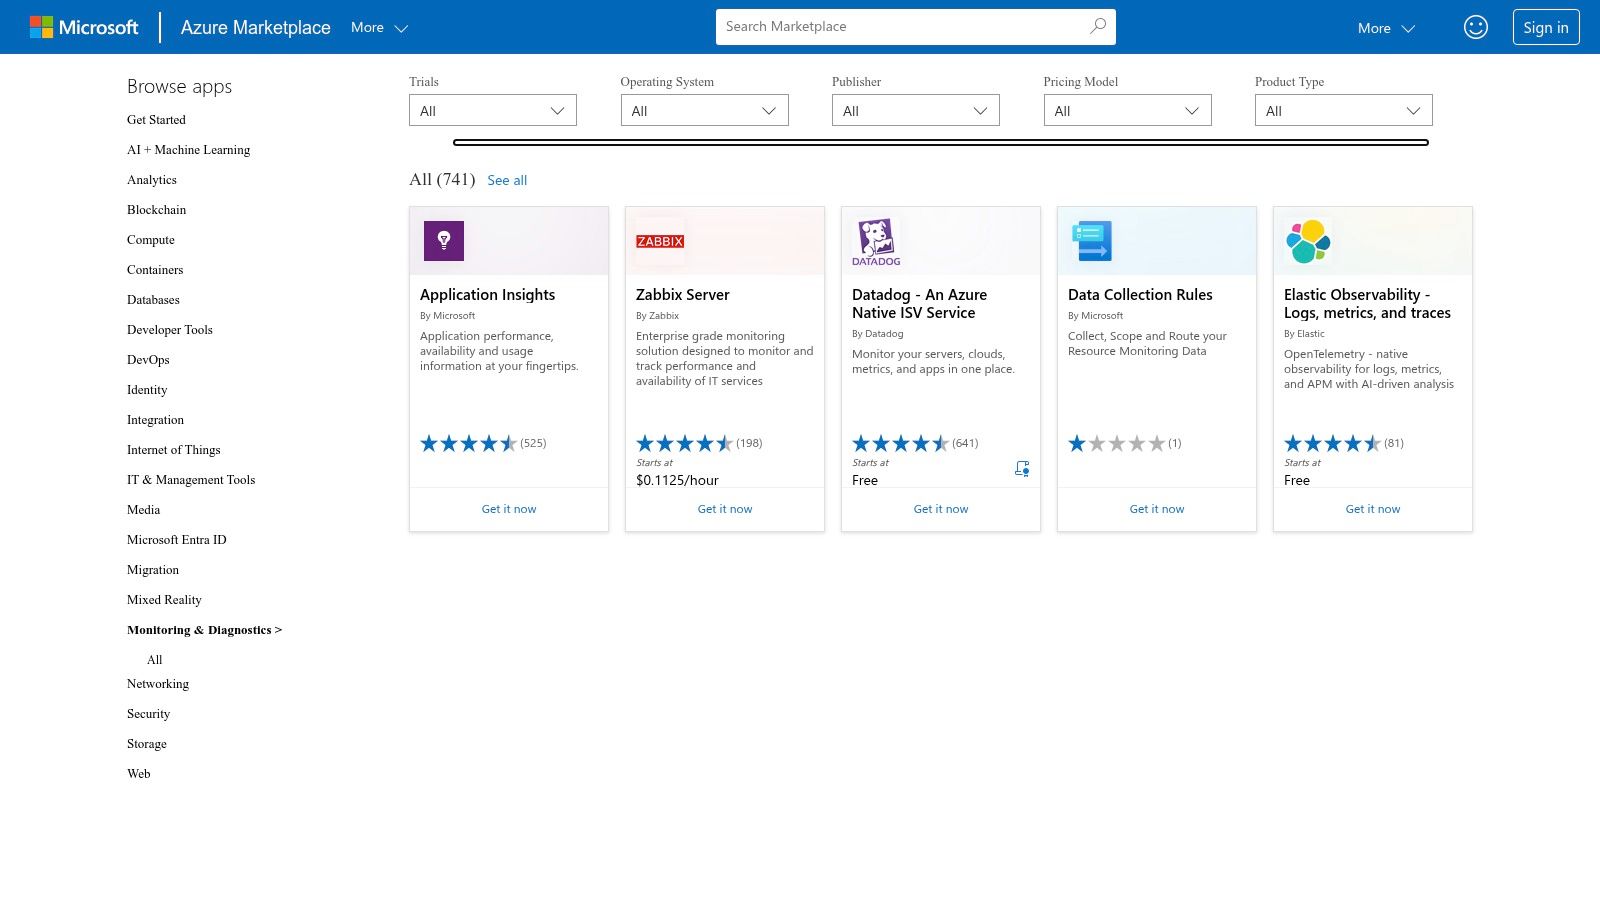
The key advantage is the native deployment experience. You can provision and configure monitoring solutions as managed applications directly into your Azure resource groups with just a few clicks, significantly reducing setup friction. Many offerings feature pay-as-you-go (PAYG) pricing tied to your Azure bill, making it easier to manage costs and scale resources alongside your Azure consumption. However, the sheer volume of options can be overwhelming, and pricing models vary significantly between publishers, necessitating careful evaluation of each solution to find the right fit for your specific technical and business requirements.
Key Information
- Best For: Azure-centric organizations looking to simplify procurement and deployment of pre-vetted, integrated monitoring solutions.
- Pricing: Varies by publisher; includes SaaS, PAYG, and bring-your-own-license (BYOL) models integrated with Azure billing.
- Pros: Streamlines procurement for Azure customers, offers Azure-native integrations reducing setup friction, many products provide trials and flexible pricing.
- Cons: Pricing and terms vary by publisher; some require contacting the vendor, large catalog can be overwhelming, requiring careful vetting.
- Website: https://azuremarketplace.microsoft.com/en-us/marketplace/apps/category/monitoring-and-diagnostics
12. G2 (Cloud Infrastructure Monitoring Category)
While not a monitoring tool itself, G2’s Cloud Infrastructure Monitoring category is an indispensable resource for evaluating and comparing the market's top solutions. It functions as a peer-review aggregator, providing user-driven rankings and detailed feedback that offer a crucial layer of validation when shortlisting the best infrastructure monitoring tools. This platform allows you to cut through marketing claims and understand how tools perform in real-world scenarios, from ease of setup to the quality of technical support.
Its unique Grid reports visually map out market leaders, contenders, and niche players based on user satisfaction and market presence. This allows technical leaders to quickly identify validated solutions that fit their specific requirements, whether filtering by company size, industry, or required technical capabilities like Kubernetes monitoring or AIOps. The ability to perform side-by-side comparisons of features and pricing using verified user reviews is invaluable for making an informed purchasing decision without committing to multiple vendor demos upfront.
Key Information
- Best For: IT managers and engineering leads validating vendor claims and shortlisting tools based on peer reviews and user satisfaction.
- Pricing: Free to browse and compare all listed software solutions.
- Pros: Access to authentic, verified customer feedback, powerful filtering to match tools to specific use cases, and visual comparison grids for quick evaluation.
- Cons: Ratings can sometimes lag behind the latest product updates or releases; it's a research aggregator, not a direct vendor.
- Website: https://www.g2.com/categories/cloud-infrastructure-monitoring
Key Features Comparison of Top 12 Infrastructure Monitoring Tools
| Product | Core Architecture & Data Collection | Technical Strengths | Target Audience | Pricing Model |
|---|---|---|---|---|
| Datadog | Unified agent (metrics, traces, logs) | 900+ integrations, mature UX, broad feature set | Enterprises needing modular tools | Modular, can escalate with usage |
| New Relic | OpenTelemetry-native, unified backend (NRDB) | Unified querying (NRQL), simple pricing, strong compliance | Dev teams needing usage-based fees | Usage-based (GB ingest) |
| Dynatrace | Single agent (OneAgent) with auto-instrumentation | AI-powered root cause analysis (Davis), Smartscape topology | Enterprises with advanced needs | Hourly pricing (Host Units) |
| Grafana Cloud | Managed open-source stack (Prometheus, Loki, Tempo) | Open standards, flexible pricing, generous free tier | Cloud-native and Kubernetes users | Component-based, pay-as-you-go |
| Elastic Observability | Elastic Stack backend (Elasticsearch) | Powerful log search (KQL), cost-effective ingest/retention | Multi-cloud operators | Serverless, per-GB ingest |
| Splunk Observability Cloud | Real-time stream processing, OpenTelemetry-native | No-sampling analytics, real-time insights, incident mgmt | Large enterprises | Host-based, tiered pricing |
| SolarWinds | SaaS & self-hosted (Orion Platform), SNMP/WMI-centric | Deep network/device monitoring, large ecosystem | On-prem & hybrid environments | Modular, volume discounts |
| Zabbix | Self-hosted server/database, agent & agentless collection | Highly customizable, no license fees, LLD | Cost-conscious with self-hosting | Free core, paid support |
| Prometheus (Official Project) | Pull-based metrics scraping, self-managed TSDB | Flexible PromQL, CNCF standard, strong community | Cloud-native, DIY monitoring | Free, self-managed |
| AWS Marketplace | Aggregator platform, deploys via CloudFormation | Simplified procurement, EDP spenddown, AWS integration | AWS users | Pay-as-you-go, varies by tool |
| Microsoft Azure Marketplace | Aggregator platform, deploys as Managed Apps | Streamlined Azure integration, unified billing | Azure customers | Pay-as-you-go, varies by vendor |
| G2 (Cloud Infra Monitoring) | Peer-review aggregator | Real user feedback, visual comparison grids | Tool buyers & researchers | Free to browse |
Implementing Your Choice: From Selection to Actionable Insights
Navigating the landscape of the best infrastructure monitoring tools can feel overwhelming, but the detailed analysis in this guide provides a clear starting point. We've explored everything from the all-in-one SaaS powerhouses like Datadog and New Relic to the specialized, open-source flexibility of Prometheus and Grafana. The key takeaway is that the "best" tool is not a universal title; it's the one that aligns most precisely with your technical stack, operational maturity, and business objectives.
For a startup with a cloud-native architecture running on Kubernetes, a combination of Grafana Cloud and Prometheus might offer the perfect blend of cost-efficiency and deep container visibility. Conversely, a large enterprise with complex hybrid environments and stringent compliance needs may find the AI-driven root cause analysis of Dynatrace or the extensive device-level integration library of SolarWinds more suitable. Your decision-making process must be a technical exercise, not a marketing one.
From Tool Selection to Operational Value
Choosing a tool is just the initial step. The real challenge, and where the most significant value is unlocked, lies in its implementation and integration into your engineering workflows. A poorly configured, best-in-class tool will always underperform a well-implemented, simpler one. True observability is achieved when your monitoring platform transitions from a passive data repository to an active, intelligent partner in your operations.
To ensure a successful deployment, focus on these critical technical pillars:
- Define Actionable SLOs: Before configuring a single dashboard, define your Service Level Objectives (SLOs) and Service Level Indicators (SLIs). What specific, measurable metrics define "good" performance for each service (e.g., p95 latency < 200ms, error rate < 0.1%)? These will become the foundation of your monitoring strategy.
- Establish a Signal-to-Noise Ratio: Alert fatigue is the primary enemy of effective incident response. Implement a tiered alerting strategy based on SLO burn rates. Use high-severity, page-worthy alerts only for critical, customer-impacting SLO breaches. Leverage lower-priority channels like Slack or email for warnings and non-urgent signals.
- Build Contextual Dashboards: Avoid creating "data graveyard" dashboards. Instead, build purpose-driven views for specific teams or services. An SRE dashboard should focus on system health and SLOs, while a developer's dashboard might highlight application performance metrics (APM), error rates, and deployment markers from the CI/CD pipeline.
- Integrate into CI/CD: Connect your monitoring tool to your deployment pipeline (e.g., Jenkins, GitLab CI, GitHub Actions). By automatically annotating dashboards and time-series graphs with deployment events, you can immediately correlate code changes with performance degradation, dramatically shortening the mean time to resolution (MTTR).
Final Thoughts: Monitoring as a Practice, Not a Purchase
Ultimately, selecting one of the best infrastructure monitoring tools is about more than just buying software; it's about adopting a culture of proactive observability and reliability engineering. The right platform, when implemented strategically, empowers your teams to move from reactive firefighting to proactive optimization. It transforms raw telemetry data into actionable insights, ensuring your systems are not only stable but also resilient and performant, directly contributing to a superior end-user experience and your bottom line.
Implementing and managing a sophisticated observability stack requires deep, specialized expertise. OpsMoon connects you with the top 0.7% of remote DevOps and SRE professionals who can design, deploy, and optimize your monitoring infrastructure. Start with a free work planning session to build a clear roadmap for achieving end-to-end visibility with the right tools.