What Is Continuous Monitoring? A Technical Guide to Real-Time System Insight
Learn what is continuous monitoring, how it enhances security and compliance. Discover strategies to implement effective monitoring today.

Forget periodic check-ups. Continuous monitoring is the practice of automatically observing your entire IT environment—from infrastructure to applications—in real time. It's not a once-a-year inspection; it's a live, multiplexed telemetry feed for your systems, constantly providing data on performance metrics, security events, and operational health.
Understanding Continuous Monitoring Without the Jargon

Here's a simple way to think about it: Picture the difference between your car's dashboard and its annual state inspection.
Your dashboard provides constant, immediate feedback—speed, engine RPM, oil pressure, and temperature. This data lets you react to anomalies the moment they occur. That is the essence of continuous monitoring. The annual inspection, conversely, only provides a state assessment at a single point in time. A myriad of issues can develop and escalate between these scheduled checks.
The Shift from Reactive to Proactive
This always-on, high-frequency data collection marks a fundamental shift from reactive troubleshooting to proactive risk management. Instead of waiting for a system to fail or a security breach to be discovered post-mortem, your teams receive an immediate feedback loop. It's about detecting anomalous signals before they cascade into system-wide failures.
This real-time visibility is a cornerstone of modern DevOps and cybersecurity. It involves the automated collection and analysis of telemetry data across your entire IT stack to detect and respond to security threats immediately, shrinking the window of vulnerability that attackers exploit. The team over at Splunk.com offers some great insights into this proactive security posture.
Continuous monitoring enables security and operations teams to slash the 'mean time to detection' (MTTD) for both threats and system failures. By shortening this crucial metric, organizations can minimize damage and restore services faster.
This constant stream of information is what makes it so powerful. You get the data needed not only to remediate problems quickly but also to perform root cause analysis (RCA) and prevent future occurrences before they manifest.
Continuous Monitoring vs Traditional Monitoring
To fully grasp the difference, it's useful to compare the legacy and modern approaches. Traditional monitoring was defined by scheduled, periodic checks—a low-frequency sampling of system state. Continuous monitoring is a high-fidelity, real-time data stream.
This table breaks down the key technical distinctions:
| Aspect | Traditional Monitoring | Continuous Monitoring |
|---|---|---|
| Timing | Scheduled, periodic (e.g., daily cron jobs, weekly reports) | Real-time, event-driven, and streaming |
| Approach | Reactive (finds problems after they occur) | Proactive (identifies risks and anomalies as they happen) |
| Scope | Often siloed on specific metrics (e.g., CPU, memory) | Holistic view across the entire stack (infra, apps, network, security) |
| Data Collection | Manual or semi-automated polling (e.g., SNMP GET) | Fully automated, continuous data streams via agents and APIs |
| Feedback Loop | High latency, with significant delays between data points | Low latency, providing immediate alerts and actionable insights |
The takeaway is simple: while traditional monitoring asks "Is the server's CPU below 80% right now?", continuous monitoring is always analyzing trends, correlations, and deviations to ask "Is system behavior anomalous, and what is the probability of a future failure?". It's a game-changer for maintaining system health, ensuring security, and achieving operational excellence.
Exploring the Three Pillars of Continuous Monitoring
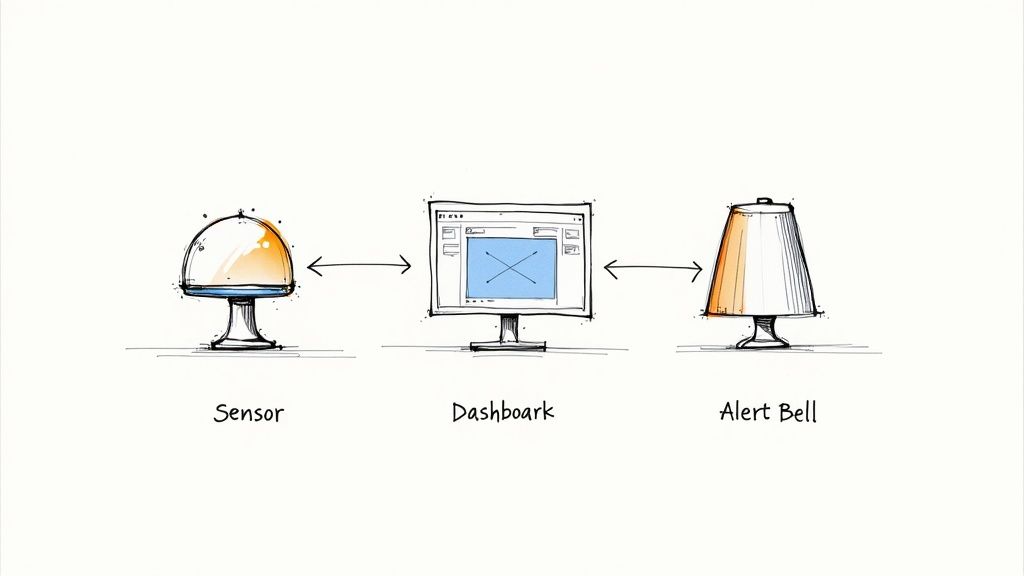
To understand continuous monitoring on a technical level, it's best to deconstruct it into three core pillars. This framework models the flow of data from raw system noise to actionable intelligence that ensures system stability and security.
This three-part structure is the engine that powers real-time visibility into your entire stack.
Pillar 1: Continuous Data Collection
The process begins with Continuous Data Collection. This foundational layer involves instrumenting every component of your IT environment to emit a constant stream of telemetry. The goal is to capture high-cardinality data from every possible source, leaving no blind spots.
This is accomplished through a combination of specialized tools:
- Agents: Lightweight daemons installed on servers, containers, and endpoints. They are designed to collect specific system metrics like CPU utilization, memory allocation, disk I/O, and network statistics.
- Log Shippers: Tools like Fluentd or Logstash are the workhorses here. They tail log files from applications and systems, parse them into structured formats (like JSON), and forward them to a centralized aggregation layer.
- Network Taps and Probes: These devices or software agents capture network traffic via port mirroring (SPAN ports) or directly, providing deep visibility into communication patterns, protocol usage, and potential security threats.
- API Polling: For cloud services and SaaS platforms, monitoring tools frequently poll vendor APIs (e.g., AWS CloudWatch API, Azure Monitor API) to ingest metrics and events.
Pillar 2: Real-Time Analysis and Correlation
Ingested raw data is high-volume but low-value. The second pillar, Real-Time Analysis and Correlation, transforms this data into meaningful information. This is where a Security Information and Event Management (SIEM) system or a modern observability platform adds significant value.
These systems apply anomaly detection algorithms and correlation rules to sift through millions of events per second. They are designed to identify complex patterns by connecting seemingly disparate data points—such as a failed login attempt from an unknown IP address on one server followed by a large data egress event on another—to signal a potential security breach or an impending system failure.
If you're curious about how this fits into the broader software delivery lifecycle, understanding the differences between continuous deployment vs continuous delivery can provide valuable context.
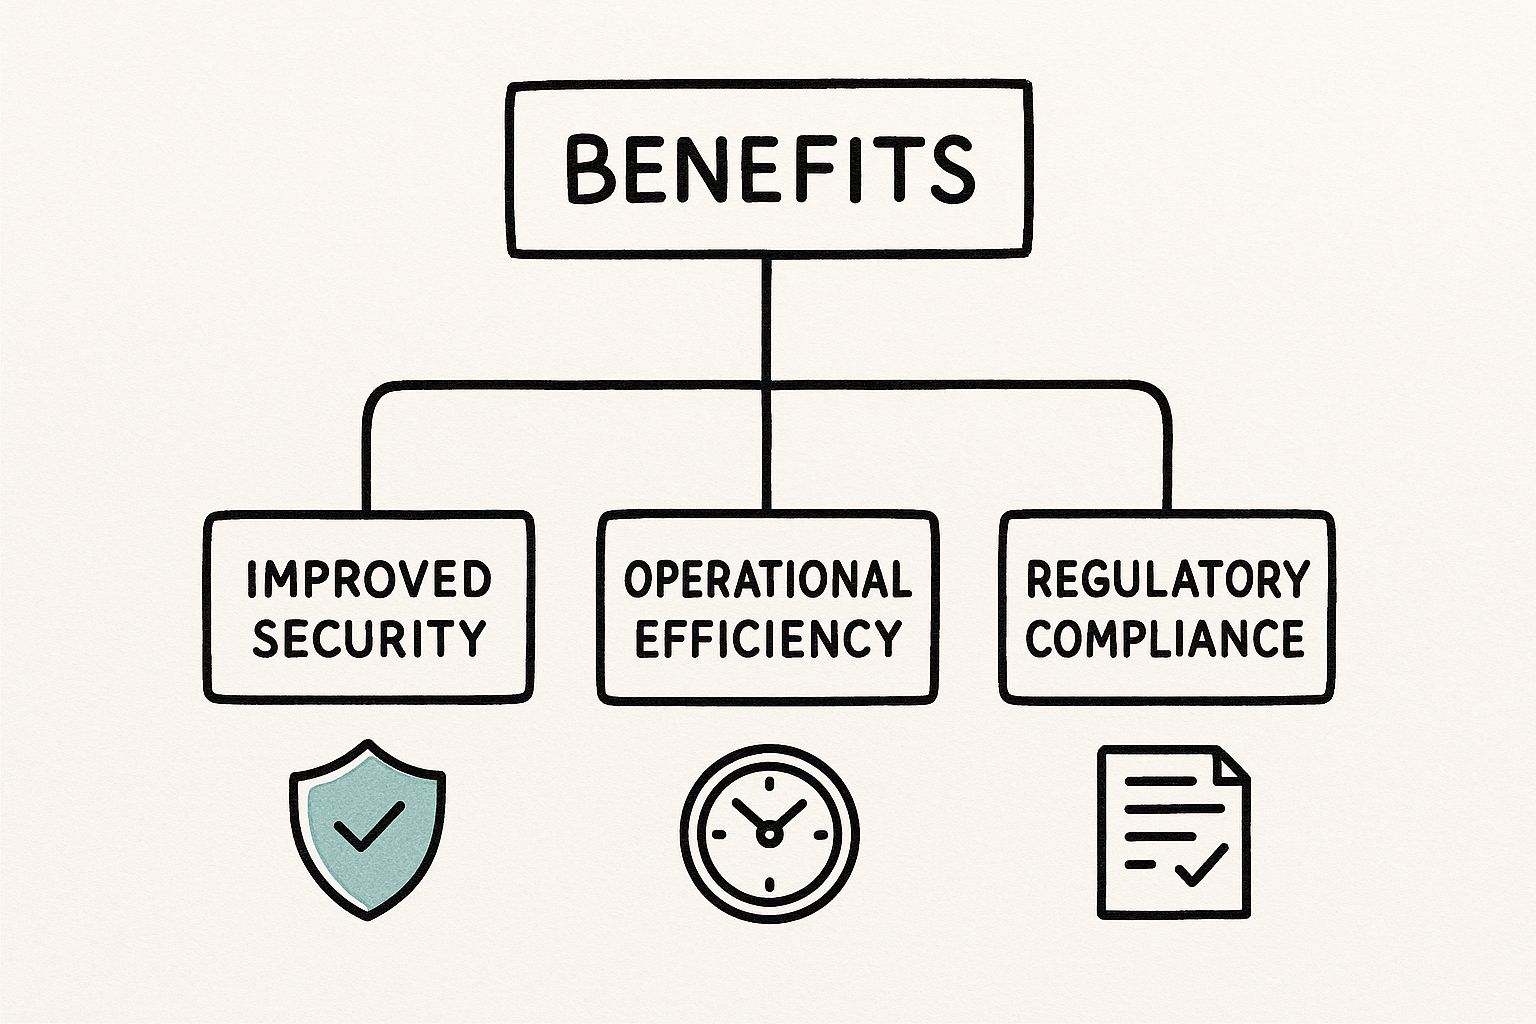
The image below gives a great high-level view of the benefits you get from this kind of systematic approach.

As you can see, a well-instrumented monitoring pipeline directly supports critical business outcomes, like enhancing security posture and optimizing operational efficiency.
Pillar 3: Automated Alerting and Response
The final pillar is Automated Alerting and Response. This is where insights are translated into immediate, programmatic action. When the analysis engine identifies a critical issue, it triggers automated workflows instead of relying solely on human intervention.
This pillar closes the feedback loop. It ensures that problem detection leads to a swift and consistent reaction, which is key to minimizing your Mean Time to Respond (MTTR).
In practice, this involves integrations with tools like PagerDuty to route high-severity alerts to on-call engineers. More advanced implementations trigger Security Orchestration, Automation, and Response (SOAR) platforms to execute predefined playbooks, such as automatically isolating a compromised container from the network or rolling back a faulty deployment.
Meeting Modern Compliance with Continuous Monitoring

For organizations in regulated industries, the annual audit is a familiar, high-stress event. Proving compliance often involves a scramble to gather evidence from disparate systems. However, these point-in-time snapshots are no longer sufficient.
Frameworks like GDPR, HIPAA, and PCI DSS demand ongoing, verifiable proof of security controls. This positions continuous monitoring as a non-negotiable component of a modern compliance program.
Instead of a single snapshot, an always-on monitoring strategy provides a continuous, auditable data stream of your security posture. This immutable log of events is precisely what auditors require—evidence that security controls are not just designed correctly, but are operating effectively, 24/7.
From Best Practice to Mandate
This is not a trend; it is a fundamental shift in compliance enforcement. Given the complexity of modern digital supply chains and the dynamic nature of cyber threats, a once-a-year audit is an obsolete model. Global compliance frameworks are increasingly codifying continuous monitoring into their requirements.
This approach is also critical for managing third-party vendor risk. By continuously monitoring the security posture of your partners, you protect your own data, secure the entire ecosystem, and ensure regulatory adherence across your supply chain.
Continuous monitoring transforms compliance from a periodic, manual event into a predictable, automated part of daily operations. It’s about having the telemetry to prove your security controls are always enforced.
For example, many organizations now utilize systems for continuous licence monitoring to ensure they remain compliant with specific industry regulations. This mindset is a core pillar of modern operational frameworks. To see how this fits into the bigger picture, it’s worth understanding what is DevOps methodology.
Ultimately, it reduces compliance from a dreaded annual examination to a managed, data-driven business function.
How to Implement a Continuous Monitoring Strategy
Implementing an effective continuous monitoring strategy is a structured engineering process. It requires transforming a flood of raw telemetry into actionable intelligence for your security and operations teams. This is not merely about tool installation; it's about architecting a systematic feedback loop for your entire environment.
The process begins with defining clear, technical objectives. You cannot monitor everything, so you must prioritize based on business impact and risk.
Define Scope and Objectives
First, identify and classify your critical assets. What are the Tier-1 services? This could be customer databases, authentication services, or revenue-generating applications. Document the specific risks associated with each asset—data exfiltration, service unavailability, or performance degradation. This initial step provides immediate focus.
With assets and risks defined, establish clear, measurable objectives using key performance indicators (KPIs). Examples include reducing Mean Time to Detection (MTTD) for security incidents below 10 minutes or achieving 99.99% uptime (a maximum of 52.6 minutes of downtime per year) for a critical API. These quantifiable goals will guide all subsequent technical decisions. For a deeper look at integrating security into your processes, our guide on DevOps security best practices is an excellent resource.
Select the Right Tools
Your choice of tools will define the scope and depth of your visibility. The market is divided between powerful open-source stacks and comprehensive commercial platforms, each with distinct trade-offs.
- Open-Source Stacks (Prometheus/Grafana): This combination is a de facto standard for metrics-based monitoring and visualization. Prometheus excels at scraping and storing time-series data from services, while Grafana provides a powerful and flexible dashboarding engine. This stack is highly customizable and extensible but requires significant engineering effort for setup, scaling, and maintenance.
- Commercial Platforms (Splunk/Datadog): Tools like Splunk and Datadog offer integrated, all-in-one solutions covering logs, metrics, and application performance monitoring (APM). They typically feature rapid deployment, a vast library of pre-built integrations, and advanced capabilities like AI-powered anomaly detection, but they operate on a consumption-based pricing model.
To help you navigate the options, here's a quick breakdown of some popular tools and what they're best at.
Key Continuous Monitoring Tools and Their Focus
| Tool | Primary Focus | Type | Key Features |
|---|---|---|---|
| Prometheus | Metrics & Alerting | Open-Source | Powerful query language (PromQL), time-series database, service discovery |
| Grafana | Visualization & Dashboards | Open-Source | Supports dozens of data sources, rich visualizations, flexible alerting |
| Datadog | Unified Observability | Commercial | Logs, metrics, traces (APM), security monitoring, real-user monitoring (RUM) in one platform |
| Splunk | Log Management & SIEM | Commercial | Advanced search and analytics for machine data, security information and event management (SIEM) |
| ELK Stack | Log Analysis | Open-Source | Elasticsearch, Logstash, and Kibana for centralized logging and visualization |
| Nagios | Infrastructure Monitoring | Open-Source | Host, service, and network protocol monitoring with a focus on alerting |
The optimal tool choice depends on a balance of your team's expertise, budget constraints, and your organization's build-versus-buy philosophy.
Configure Data Sources and Baselines
Once tools are selected, the next step is data ingestion. This involves deploying agents on your servers, configuring log forwarding from applications, and integrating with cloud provider APIs. The objective is to establish a unified telemetry pipeline that aggregates data from every component in your stack.
After data begins to flow, the critical work of establishing performance baselines commences. This involves analyzing historical data to define "normal" operating ranges for key metrics like CPU utilization, API response latency, and error rates. Without a statistically significant baseline, you cannot effectively detect anomalies or configure meaningful alert thresholds. This process is the foundation of effective data-driven decision-making.
Finally, configure alerting rules and response workflows. The goal is to create high-signal, low-noise alerts that are directly tied to your objectives. Couple these with automated playbooks that can handle initial triage or simple remediation tasks, freeing up your engineering team to focus on critical incidents that require human expertise.
Applying Continuous Monitoring in OT and Industrial Environments

Continuous monitoring is not limited to corporate data centers and cloud infrastructure. It plays a mission-critical role in Operational Technology (OT) and industrial control systems (ICS), where a digital anomaly can precipitate a kinetic, real-world event.
In sectors like manufacturing, energy, and utilities, the stakes are significantly higher. A server outage is an inconvenience; a power grid failure or a pipeline rupture is a catastrophe. Here, continuous monitoring evolves from tracking IT metrics to overseeing the health and integrity of large-scale physical machinery.
From IT Metrics to Physical Assets
In an OT environment, the monitoring paradigm shifts. Data is collected and analyzed from a sprawling network of sensors, programmable logic controllers (PLCs), and other industrial devices. This data stream provides a real-time view of the operational integrity of physical assets.
Instead of only monitoring for cyber threats, teams look for physical indicators such as:
- Vibrational Anomalies: Unexpected changes in a machine's vibrational signature can be an early indicator of impending mechanical failure.
- Temperature Spikes: Thermal runaway is a classic and dangerous indicator of stress on critical components.
- Pressure Fluctuations: In fluid or gas systems, maintaining correct pressure is non-negotiable for safety and operational efficiency.
Continuous monitoring in OT is the bridge between the digital and physical worlds. It uses data to protect industrial infrastructure from both sophisticated cyber-attacks and the fundamental laws of physics.
By continuously analyzing this stream of sensor data, organizations can transition from reactive to predictive maintenance. This shift prevents costly, unplanned downtime and can significantly extend the operational lifespan of heavy machinery. The impact is measurable: industries leveraging this approach can reduce downtime by up to 30% and cut maintenance costs by as much as 40%. You can get a deeper look at how this is changing the industrial game in this in-depth article on mfe-is.com.
Ultimately, applying continuous monitoring principles to industrial settings is about ensuring operational reliability, mitigating major physical risks, and protecting both personnel and assets in real time.
Frequently Asked Questions About Continuous Monitoring
Even with a solid strategy, practical and technical questions inevitably arise during implementation. Let's address some of the most common queries from engineers and security professionals.
What Is the Difference Between Continuous Monitoring and Observability?
This question is common because the terms are often used interchangeably, but they represent distinct, complementary concepts for understanding system behavior.
Continuous monitoring is about the known-unknowns. You configure checks for metrics and events you already know are important. It's analogous to a car's dashboard—it reports on speed, fuel level, and engine temperature. It answers questions like, "Is CPU utilization over 80%?" or "Is our API latency exceeding the 200ms SLO?" It tells you when a predefined condition is met.
Observability, conversely, is about the unknown-unknowns. It's the capability you need when your system exhibits emergent, unpredictable behavior. It leverages high-cardinality telemetry (logs, metrics, and traces) to allow you to ask new questions on the fly and debug novel failure modes. It helps you understand why something is failing in a way you never anticipated.
In short: monitoring tells you that a specific, predefined threshold has been crossed. Observability gives you the raw data and tools to debug bizarre, unexpected behavior. A resilient system requires both.
How Do You Avoid Alert Fatigue?
Alert fatigue is a serious operational risk. A high volume of low-value notifications desensitizes on-call teams, causing them to ignore or miss critical alerts signaling a major outage. The objective is to achieve a high signal-to-noise ratio where every alert is meaningful and actionable.
Here are technical strategies to achieve this:
- Set Dynamic Baselines: Instead of static thresholds, use statistical methods (e.g., moving averages, standard deviation) to define "normal" behavior. This drastically reduces false positives caused by natural system variance.
- Tier Your Alerts: Classify alerts by severity (e.g., P1-P4). A P1 critical failure should trigger an immediate page, whereas a P3 minor deviation might only generate a ticket in a work queue for business hours.
- Correlate Events: Instead of firing 50 separate alerts when a database fails, use an event correlation engine to group them into a single, context-rich incident. The team receives one notification that shows the full blast radius, not a storm of redundant pings.
- Tune Thresholds Regularly: Systems evolve, and so should your alerts. Make alert tuning a regular part of your operational sprints. Review noisy alerts and adjust thresholds or logic to improve signal quality.
Can Small Organizations Implement Continuous Monitoring Effectively?
Absolutely. A large budget or a dedicated Site Reliability Engineering (SRE) team is not a prerequisite. While enterprises may invest in expensive commercial platforms, the open-source ecosystem has democratized powerful monitoring capabilities.
A highly capable, low-cost stack can be built using industry-standard open-source tools. For example, combining Prometheus for metrics collection, Grafana for dashboarding, and the ELK Stack (Elasticsearch, Logstash, Kibana) for log aggregation provides a robust foundation that can scale from a startup to a large enterprise.
Furthermore, major cloud providers offer managed monitoring services that simplify initial adoption. Services like AWS CloudWatch and Azure Monitor operate on a pay-as-you-go model and abstract away the underlying infrastructure management. For a small business or startup, this is often the most efficient path to implementing a continuous monitoring strategy.
Navigating the world of DevOps and continuous monitoring can feel overwhelming. At OpsMoon, we connect you with the top 0.7% of remote DevOps engineers who live and breathe this stuff. Whether you're trying to build an observability stack from scratch or fine-tune your CI/CD pipelines, our experts are here to help.
Start with a free work planning session to map your DevOps roadmap today!
