7 Actionable Infrastructure Monitoring Best Practices for Production Systems
 By opsmoon
Master these 7 infrastructure monitoring best practices to enhance reliability and performance. Get actionable tips on observability, alerting, and IaC.
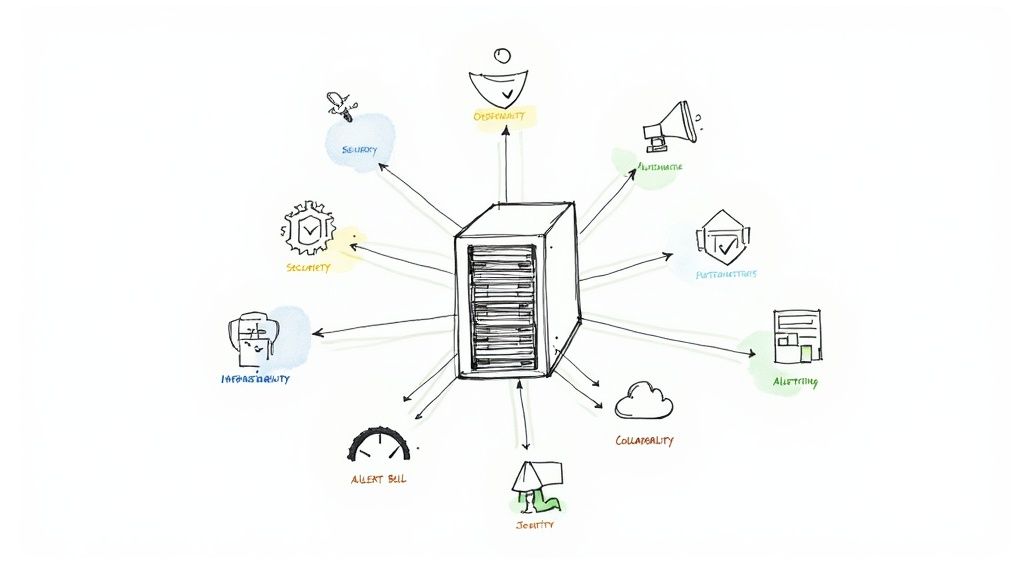
In today's distributed environments, legacy monitoring—simply watching CPU and memory graphs—is an invitation to failure. Modern infrastructure demands a proactive, deeply technical, and automated strategy that provides a holistic, machine-readable view of system health. This is not about dashboards; it is about data-driven control.
This guide provides a technical deep-dive into the essential infrastructure monitoring best practices that elite engineering teams use to build resilient, high-performing systems. We will explore actionable techniques for immediate implementation, from establishing comprehensive observability with OpenTelemetry to automating remediation with event-driven runbooks. This is a practical blueprint for transforming your monitoring from a reactive chore into a strategic advantage that drives operational excellence.
You will learn how to build robust, code-defined alerting systems, manage monitoring configurations with Terraform, and integrate security signal processing directly into your observability pipeline. Let's examine the seven critical practices that will help you gain control over your infrastructure, preempt failures, and ensure your services remain fast, reliable, and secure.
1. Comprehensive Observability with the Three Pillars
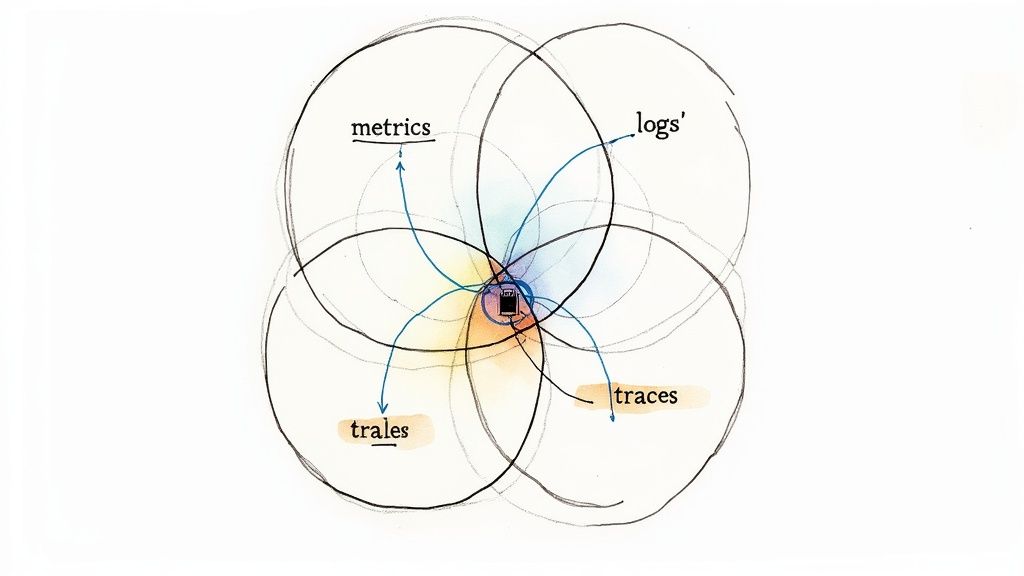
Effective infrastructure monitoring best practices begin with a foundational shift from simple monitoring to deep observability. This means moving beyond isolated health checks to a holistic understanding of your system’s internal state, derived from its outputs. The industry-standard approach to achieve this is through the "three pillars of observability": metrics, logs, and traces. Each pillar provides a unique perspective, and their combined power, when correlated, eliminates critical blind spots.
- Metrics: Time-series numerical data (e.g.,
http_requests_total,container_cpu_usage_seconds_total). Metrics are aggregated and ideal for mathematical modeling, trend analysis, and triggering alerts on SLO violations. For example, an alert defined in PromQL:sum(rate(http_requests_total{status_code=~"5.."}[5m])) / sum(rate(http_requests_total[5m])) > 0.01. - Logs: Immutable, timestamped records of discrete events, typically in a structured format like JSON. Logs provide granular, context-rich details for debugging specific errors, such as a stack trace or the exact payload of a failed API request.
- Traces: A visualization of a single request's journey through a distributed system. Each step in the journey is a "span," and a collection of spans forms a trace. Traces are indispensable for identifying latency bottlenecks in a microservices architecture by showing which service call in a long chain is introducing delay.
Why This Approach Is Crucial
Relying on just one or two pillars creates an incomplete picture. Metrics might show high latency (p99_latency_ms > 500), but only logs can reveal the NullPointerException causing it. Logs might show an error, but only a trace can pinpoint that the root cause is a slow database query in an upstream dependency.
Netflix's observability platform, Cosmos, is a prime example of this model at scale, correlating metrics from Atlas with distributed traces to manage its massive microservices fleet. Similarly, Uber's development and open-sourcing of the Jaeger tracing system was a direct response to the need to debug complex service interactions that were impossible to understand with logs alone. Correlating the three pillars is non-negotiable for maintaining reliability at scale.
How to Implement the Three Pillars
Integrating the three pillars requires a focus on standardization and correlation.
- Standardize and Correlate: The critical factor is correlation. Implement a system where a unique
trace_idis generated at the system's entry point (e.g., your API gateway or load balancer) and propagated as an HTTP header (liketraceparentin the W3C Trace Context standard) to every subsequent service call. This ID must be injected into every log line and attached as a label/tag to every metric emitted during the request's lifecycle. This allows you to pivot seamlessly from a high-latency trace to the specific logs and metrics associated with that exact request. - Adopt Open Standards: Leverage OpenTelemetry (OTel). OTel provides a unified set of APIs, SDKs, and agents to collect metrics, logs, and traces from your applications and infrastructure. Using the OTel Collector, you can receive telemetry data in a standard format (OTLP), process it (e.g., add metadata, filter sensitive data), and export it to any backend of your choice, preventing vendor lock-in.
- Choose Integrated Tooling: Select an observability platform like Datadog, New Relic, or a self-hosted stack like Grafana (with Loki for logs, Mimir for metrics, and Tempo for traces). The key is the platform's ability to ingest and automatically link these three data types. This dramatically reduces mean time to resolution (MTTR) by allowing an engineer to jump from a metric anomaly to the associated traces and logs with a single click.
2. Proactive Alerting and Intelligent Notification Systems
An effective infrastructure monitoring practice moves beyond simply collecting data to implementing a smart, actionable alerting strategy. Proactive alerting is about building an intelligent notification system that delivers context-rich alerts to the right person at the right time via the right channel. This approach focuses on preventing "alert fatigue" by using dynamic thresholds, severity-based routing, and linking alerts directly to version-controlled runbooks, ensuring that every notification is a signal, not noise.

Why This Approach Is Crucial
A stream of low-value, unactionable alerts desensitizes on-call engineers, leading to slower response times for genuine incidents. An intelligent system acts as a signal processor, distinguishing between benign fluctuations and precursor signals of a major outage. It ensures that when an engineer is paged at 3 AM, the issue is both real, urgent, and comes with the necessary context to begin diagnosis.
This model is a core tenet of Google's SRE philosophy, which emphasizes alerting on symptom-based Service Level Objectives (SLOs) rather than causes. For instance, Shopify uses PagerDuty to route critical e-commerce platform alerts based on service ownership defined in a YAML file, drastically reducing its mean time to acknowledge (MTTA). Similarly, Datadog's anomaly detection algorithms allow teams at Airbnb to move beyond static thresholds (CPU > 90%), triggering alerts only when behavior deviates from a baseline model trained on historical data.
How to Implement Intelligent Alerting
Building a robust alerting system requires a multi-faceted approach focused on relevance, context, and continuous improvement.
- Define Actionable Alerting Conditions: Every alert must be actionable and tied to user-facing symptoms. Instead of alerting on high CPU, alert on high p99 request latency or an elevated API error rate (your Service Level Indicator or SLI). Every alert definition should include a link to a runbook in its payload. The runbook, stored in a Git repository, must provide specific diagnostic queries (
kubectl logs...,grep...) and step-by-step remediation commands. - Implement Multi-Tiered Severity and Routing: Classify alerts into severity levels (e.g.,
SEV1: Critical outage,SEV2: Imminent threat,SEV3: Degraded performance). Configure routing rules in a tool like Opsgenie or PagerDuty. ASEV1alert should trigger a phone call and SMS to the primary on-call engineer and auto-escalate if not acknowledged within 5 minutes. ASEV2might post to a dedicated Slack channel (#ops-alerts), while aSEV3could automatically create a Jira ticket with a low priority. - Leverage Anomaly and Outlier Detection: Utilize monitoring tools with built-in machine learning capabilities to create dynamic, self-adjusting thresholds. This is critical for systems with cyclical traffic patterns. A static threshold might fire every day at peak traffic, while an anomaly detection algorithm understands the daily rhythm and only alerts on a true deviation from the norm. Regularly conduct "noisy alert" post-mortems to prune or refine alerts that are not providing clear, actionable signals.
3. Real-time Performance Metrics Collection and Analysis
Beyond a foundational observability strategy, one of the most critical infrastructure monitoring best practices is the high-frequency collection and analysis of performance data in real-time. This involves moving from delayed, batch-processed insights to an instantaneous view of system health. It means scraping system-level metrics (e.g., from a Kubernetes node exporter) and custom application metrics (e.g., from a /metrics endpoint) at a high resolution (e.g., every 15 seconds), enabling immediate anomaly detection and trend prediction.
- System Metrics: Core indicators from the OS and hardware, like
node_cpu_seconds_totalandnode_network_receive_bytes_total. - Application Metrics: Custom, business-relevant data points instrumented directly in your code, such as
http_requests_total{method="POST", path="/api/v1/users"}orkafka_consumer_lag. - Real-time Analysis: Using a query language like PromQL to perform on-the-fly aggregations and calculations on a streaming firehose of data to power live dashboards and alerts.

Why This Approach Is Crucial
In dynamic, auto-scaling environments, a five-minute data aggregation interval is an eternity. A critical failure can occur and resolve (or cascade) within that window, leaving you blind. Real-time metrics allow you to detect a sudden spike in error rates or latency within seconds, triggering automated rollbacks or alerting before a significant portion of users are affected.
This practice was popularized by Prometheus, originally developed at SoundCloud to monitor a highly dynamic microservices environment. Its pull-based scraping model and powerful query language became the de facto standard for cloud-native monitoring. Companies like Cloudflare built custom pipelines to process billions of data points per minute, demonstrating that real-time visibility is essential for operating at a global scale.
How to Implement Real-time Metrics
Deploying an effective real-time metrics pipeline requires careful architectural decisions.
- Select a Time-Series Database (TSDB): Standard relational databases are entirely unsuitable. Choose a specialized TSDB like Prometheus, VictoriaMetrics, or InfluxDB. Prometheus's pull-based model is excellent for service discovery in environments like Kubernetes, while a push-based model supported by InfluxDB or VictoriaMetrics can be better for ephemeral serverless functions or batch jobs.
- Define a Metrics Strategy: Control metric cardinality. Every unique combination of key-value labels creates a new time series. Avoid high-cardinality labels like
user_idorrequest_id, as this will overwhelm your TSDB. For example, usehttp_requests_total{path="/users/{id}"}instead ofhttp_requests_total{path="/users/123"}. Instrument your code with libraries that support histograms or summaries to efficiently track latency distributions. - Establish Data Retention Policies: Infinite retention of high-resolution data is cost-prohibitive. Implement tiered retention and downsampling. For example, use Prometheus to store raw, 15-second resolution data locally for 24 hours. Then, use a tool like Thanos or Cortex to ship that data to cheaper object storage (like S3), where it is downsampled to 5-minute resolution for 90-day retention and 1-hour resolution for long-term (multi-year) trend analysis. Exploring the various application performance monitoring tools can provide deeper insight into how different platforms handle this.
4. Infrastructure as Code (IaC) for Monitoring Configuration
One of the most powerful infrastructure monitoring best practices is treating your monitoring setup as version-controlled code. This is known as Infrastructure as Code (IaC) or, more specifically, Monitoring as Code. It involves defining alerts, dashboards, synthetic checks, and data collection agents using declarative configuration files (e.g., HCL for Terraform, YAML for Kubernetes operators).
Instead of manually creating an alert in a UI, an engineer defines it in a Terraform file:
resource "datadog_monitor" "api_latency" {
  name    = "API p99 Latency is too high on {{host.name}}"
  type    = "metric alert"
  query   = "p99:trace.http.request.duration{service:api-gateway,env:prod} > 0.5"
  # ... other configurations
}
This file is committed to Git, reviewed via a pull request, and automatically applied by a CI/CD pipeline. This eliminates configuration drift, provides a full audit trail, and ensures monitoring parity between staging and production.
Why This Approach Is Crucial
Manual configuration is brittle, error-prone, and unscalable. IaC makes your monitoring setup as reliable and manageable as your application code. It enables disaster recovery by allowing you to redeploy your entire monitoring stack from code. It also empowers developers to own the monitoring for their services by including alert definitions directly in the service's repository.
Spotify uses Terraform to programmatically manage thousands of Datadog monitors, ensuring consistency across hundreds of microservices. Similarly, Capital One employs a GitOps workflow where changes to a Git repository are automatically synced to Grafana, versioning every dashboard. These examples prove that a codified monitoring strategy is essential for achieving operational excellence at scale. To learn more, explore these Infrastructure as Code best practices.
How to Implement IaC for Monitoring
Adopting IaC for monitoring is an incremental process that delivers immediate benefits.
- Select the Right Tool: Choose an IaC tool with a robust provider for your monitoring platform. Terraform has mature providers for Datadog, Grafana, New Relic, and others. The Prometheus Operator for Kubernetes allows you to define
PrometheusRulecustom resources in YAML. Pulumi lets you use languages like Python or TypeScript for more complex logic. - Start Small and Modularize: Begin by codifying a single team's dashboards or a set of critical SLO-based alerts. Create reusable Terraform modules for standard alert types. For example, a
service-slosmodule could take variables likeservice_nameandlatency_thresholdand generate a standard set of availability, latency, and error rate monitors. - Integrate with CI/CD: The real power is unlocked through automation. Set up a CI/CD pipeline (e.g., using GitHub Actions or Jenkins) that runs
terraform planon pull requests andterraform applyon merge to the main branch. This creates a fully automated, auditable "monitoring-as-code" workflow and prevents manual "hotfixes" in the UI that lead to drift.
5. Distributed System and Microservices Monitoring
Traditional, host-centric infrastructure monitoring best practices fail when applied to modern distributed architectures. Monitoring microservices requires a specialized approach that focuses on service interactions, dependencies, and emergent system behavior rather than individual component health.
- Service Dependency Mapping: Dynamically generating a map of which services communicate with each other, crucial for understanding blast radius during an incident.
- Inter-Service Communication: Monitoring focuses on the "golden signals" (latency, traffic, errors, saturation) for east-west traffic (service-to-service), which is often more critical than north-south traffic (user-to-service).
- Distributed Tracing: As discussed earlier, this is non-negotiable for following a single request's journey across multiple service boundaries to pinpoint failures and performance bottlenecks.
Why This Approach Is Crucial
In a microservices environment, a failure in one small, non-critical service can trigger a catastrophic cascading failure. Monitoring individual pod CPU is insufficient; you must monitor the health of the API contracts and network communication between services. A single slow service can exhaust the connection pools of all its upstream dependencies.
Netflix's Hystrix library (a circuit breaker pattern implementation) was developed specifically to prevent these cascading failures. Uber's creation of Jaeger was a direct response to the challenge of debugging a request that traversed hundreds of services. These tools address the core problem: understanding system health when the "system" is a dynamic and distributed network.
How to Implement Microservices Monitoring
Adopting this paradigm requires a shift in tooling and mindset.
- Implement Standardized Health Checks: Each microservice must expose a standardized
/healthendpoint that returns a structured JSON payload indicating its status and the status of its direct downstream dependencies (e.g., database connectivity). Kubernetes liveness and readiness probes should consume these endpoints to perform automated healing (restarting unhealthy pods) and intelligent load balancing (not routing traffic to unready pods). - Use a Service Mesh: Implement a service mesh like Istio or Linkerd. These tools use a sidecar proxy (like Envoy) to intercept all network traffic to and from your service pods. This provides rich, out-of-the-box telemetry (metrics, logs, and traces) for all service-to-service communication without any application code changes. You get detailed metrics on request latency, error rates (including specific HTTP status codes), and traffic volume for every service pair.
- Define and Monitor SLOs Per-Service: Establish specific Service Level Objectives (SLOs) for the latency, availability, and error rate of each service's API. For example: "99.9% of
/usersGET requests over a 28-day window should complete in under 200ms." This creates a data-driven error budget for each team, giving them clear ownership and accountability for their service's performance. For more information, you can learn more about microservices architecture design patterns on opsmoon.com.
6. Automated Remediation and Self-Healing Systems
Advanced infrastructure monitoring best practices evolve beyond simple alerting to proactive, automated problem-solving. This is the realm of event-driven automation or self-healing systems, where monitoring data directly triggers automated runbooks to resolve issues without human intervention. This minimizes mean time to resolution (MTTR), reduces on-call burden, and frees engineers for proactive work.
- Detection: A Prometheus alert fires, indicating a known issue (e.g.,
KubePodCrashLooping). - Trigger: The Alertmanager sends a webhook to an automation engine like Rundeck or a serverless function.
- Execution: The engine executes a pre-defined, version-controlled script that performs diagnostics (e.g.,
kubectl describe pod,kubectl logs --previous) and then takes a remediation action (e.g.,kubectl rollout restart deployment). - Verification: The script queries the Prometheus API to confirm that the alert condition has cleared. The results are posted to a Slack channel for audit purposes.
Why This Approach Is Crucial
The time it takes for a human to receive an alert, log in, diagnose, and fix a common issue can lead to significant SLO violations. Self-healing systems compress this entire process into seconds. They represent a mature stage of SRE, transforming operations from reactive to programmatic.
Kubernetes is a prime example of this concept, with its built-in controllers that automatically reschedule failed pods or scale deployments. Netflix's resilience strategy relies heavily on automated recovery, terminating unhealthy instances and allowing auto-scaling groups to replace them. This automation isn't a convenience; it's a core requirement for operating services that demand near-perfect uptime.
How to Implement Self-Healing
Building a robust self-healing system requires a cautious, incremental approach. To understand the broader implications and benefits of automation, it's useful to consider real-world business process automation examples that streamline operations.
- Start with Low-Risk, High-Frequency Issues: Begin by automating responses to well-understood, idempotent problems. A classic starting point is automatically restarting a stateless service that has entered a crash loop. Other good candidates include clearing a full cache directory or scaling up a worker pool in response to a high queue depth metric.
- Use Runbook Automation Tools: Leverage platforms like PagerDuty Process Automation (formerly Rundeck), Ansible, or Argo Workflows. These tools allow you to codify your operational procedures into version-controlled, repeatable workflows that can be triggered by API calls or webhooks from your monitoring system.
- Implement Circuit Breakers and Overrides: To prevent runaway automation from causing a wider outage, build in safety mechanisms. A "circuit breaker" can halt automated actions if they are being triggered too frequently (e.g., more than 3 times in 5 minutes) or are failing to resolve the issue. Always have a clear manual override process, such as a "pause automation" button in your control panel or a feature flag.
7. Security and Compliance Monitoring Integration
A modern approach to infrastructure monitoring best practices demands that security is not a separate silo but an integral part of your observability fabric. This is often called DevSecOps and involves integrating security information and event management (SIEM) data and compliance checks directly into your primary monitoring platform. This provides a single pane of glass to correlate operational performance with security posture.
- Security Signals: Ingesting events from tools like Falco (runtime security), Wazuh (HIDS), or cloud provider logs (e.g., AWS CloudTrail). This allows you to correlate a CPU spike on a host with a
falcoalert for unexpected shell activity in a container. - Compliance Checks: Using tools like Open Policy Agent (OPA) or Trivy to continuously scan your infrastructure configurations (both in Git and in production) against compliance benchmarks like CIS or NIST. Alerts are triggered for non-compliant changes, such as a Kubernetes network policy being too permissive.
- Audit Logs: Centralizing all audit logs (e.g.,
kube-apiserveraudit logs, database access logs) to track user and system activity for forensic analysis and compliance reporting.
Why This Approach Is Crucial
Monitoring infrastructure health without considering security is a critical blind spot. A security breach is the ultimate system failure. When security events are in a separate tool, correlating a DDoS attack with a latency spike becomes a manual, time-consuming process that extends your MTTR.
Microsoft's Azure Sentinel integrates directly with Azure Monitor, allowing teams to view security alerts alongside performance metrics and trigger automated responses. Similarly, Capital One built Cloud Custodian, an open-source tool for real-time compliance enforcement in the cloud. These examples show that merging these data streams is essential for proactive risk management.
How to Implement Security and Compliance Integration
Unifying these disparate data sources requires a strategic approach focused on centralization and automation.
- Centralize Security and Operational Data: Use a platform with a flexible data model, like the Elastic Stack (ELK) or Splunk, to ingest and parse diverse data types. The goal is to have all data in one queryable system where you can correlate a performance metric from Prometheus with an audit log from CloudTrail and a security alert from your endpoint agent.
- Automate Compliance Auditing: Shift compliance left by integrating security scanning into your CI/CD pipeline. Use tools like
checkovto scan Terraform plans for misconfigurations (e.g., publicly exposed S3 buckets) and fail the build if policies are violated. Use tools like the Kubernetes OPA Gatekeeper to enforce policies at admission time on your cluster. Learn more about how to master data security compliance to build a robust framework. - Implement Role-Based Access Control (RBAC): As you centralize sensitive security data, it's critical to control access. Implement strict RBAC policies within your observability platform. For example, an application developer might have access to their service's logs and metrics, while only a member of the security team can view raw audit logs or modify security alert rules.
7 Key Practices Comparison Guide
| Item | Implementation Complexity | Resource Requirements | Expected Outcomes | Ideal Use Cases | Key Advantages |
|---|---|---|---|---|---|
| Comprehensive Observability with the Three Pillars | High – requires integration of metrics, logs, traces | High – storage, processing, skilled personnel | Complete visibility, faster root cause analysis | End-to-end system monitoring | Unified view, better incident response |
| Proactive Alerting and Intelligent Notification Systems | Moderate to high – complex initial setup and tuning | Moderate – alert systems, tuning efforts | Reduced alert fatigue, faster response | Incident management, on-call teams | Minimized noise, context-aware notifications |
| Real-time Performance Metrics Collection and Analysis | Moderate to high – handling high-frequency data | High – bandwidth, storage, time-series DBs | Early detection of issues, data-driven insights | Performance monitoring, capacity planning | Real-time trend detection, improved reliability |
| Infrastructure as Code (IaC) for Monitoring Configuration | Moderate – requires coding and automation skills | Moderate – tooling and pipeline integration | Consistent, reproducible monitoring setups | Multi-environment config management | Version control, reduced human error |
| Distributed System and Microservices Monitoring | High – complexity of distributed systems | High – instrumentation, correlation efforts | Visibility into microservices, faster troubleshooting | Monitoring complex distributed architectures | Detailed dependency mapping, cross-service insights |
| Automated Remediation and Self-Healing Systems | High – complex automation and safety design | Moderate to high – automation infrastructure | Reduced MTTR, 24/7 automated response | Critical infrastructure with automation | Consistent remediation, reduced manual overhead |
| Security and Compliance Monitoring Integration | High – combining security with operational monitoring | High – security scanning, audit data storage | Faster security incident detection, compliance | Organizations with strict security needs | Unified security and operational visibility |
Build a Resilient Future with Expert Monitoring
Mastering infrastructure monitoring is a journey of continuous technical refinement. Moving beyond basic uptime checks to a sophisticated, proactive strategy is essential for building resilient, high-performing systems. The infrastructure monitoring best practices outlined in this guide are not isolated tactics; they are interconnected components of a holistic operational philosophy. By weaving them together, you transform your infrastructure from a potential point of failure into a powerful competitive advantage.
Key Takeaways for a Proactive Monitoring Culture
Adopting these principles requires a cultural shift towards data-driven engineering and proactive reliability.
- Embrace True Observability: Go beyond simple metrics. Integrating the three pillars—metrics, logs, and traces—with strict correlation provides the deep, contextual insights necessary to understand not just what failed, but why. This comprehensive view is non-negotiable for debugging complex microservices architectures.
- Automate Everything: From configuration management with IaC to event-driven remediation, automation is the key to scalability and consistency. It reduces human error, frees up engineering time, and ensures your monitoring can keep pace with rapid deployment cycles.
- Make Alerting Actionable: Drowning in a sea of low-priority alerts leads to fatigue and missed critical incidents. Implementing intelligent, SLO-based alerting tied to version-controlled runbooks ensures that your team only receives notifications that require immediate, specific action.
From Theory to Implementation: Your Next Steps
The ultimate goal of advanced monitoring is not just to fix problems faster, but to prevent them from ever impacting your users. This requires a resilient infrastructure fortified by strategic foresight. A crucial part of this strategy extends beyond technical implementation; exploring how a robust approach to business contingency planning can complement your monitoring efforts to safeguard against unforeseen disruptions and ensure operational continuity.
By investing in these infrastructure monitoring best practices, you are building more than just a stable system. You are fostering an engineering culture where innovation can thrive, confident that the underlying platform is robust, secure, and observable. This foundation empowers your teams to deploy faster, experiment with confidence, and deliver exceptional value to your customers. The path to monitoring excellence is an ongoing process of refinement, but the rewards—unmatched reliability, enhanced security, and accelerated business velocity—are well worth the commitment.
Implementing these advanced strategies requires deep expertise in tools like Prometheus, Kubernetes, and Terraform. OpsMoon connects you with the top 0.7% of elite, pre-vetted DevOps and SRE freelancers who can architect and implement a world-class monitoring framework tailored to your specific needs. Start your journey to a more resilient infrastructure by booking a free work planning session today.