A Technical Guide to Application Performance Optimization
 By opsmoon
A technical guide to application performance optimization. Learn actionable strategies for profiling, code-level tuning, and front-end optimization.
Optimizing your app without first defining what "fast" means is a recipe for disaster. It's like attempting a kernel compilation with no make configuration. Application performance optimization always starts with one thing: a clear, data-driven baseline established through robust instrumentation.
This baseline is your single source of truth. It transforms vague complaints like "the app feels sluggish" into concrete, measurable problems, like "the p99 latency for the /api/v1/auth endpoint has regressed by 300ms since the last deployment."
Establishing Your Performance Baseline

Before you can fix what's slow, you need a technical framework for what 'fast' means for your services. This isn't about guesswork; it's about instrumenting your code with agents (e.g., OpenTelemetry, New Relic) and monitoring the metrics that matter. The goal is to build a comprehensive performance dashboard in a tool like Grafana or Datadog that gives you the hard data you need to find real bottlenecks.
Honestly, this first measurement phase is non-negotiable. If you skip it, you're flying blind. You'll end up wasting precious engineering cycles on "optimizations" that don't even touch the core issues, like refactoring a function that only accounts for 1% of total execution time.
How to Quantify User Satisfaction with Apdex
One of the most powerful tools is the Application Performance Index, or Apdex. It’s an industry-standard method to measure user satisfaction based on your application's response time. It converts complex performance data into a single score from 0 to 1, which tells you if your users are experiencing satisfactory performance or not.
To implement Apdex, you define a time threshold, T, for what you consider a "satisfactory" response time. For a critical API endpoint, you might set T to 100 milliseconds.
From there, every transaction falls into one of three buckets:
- Satisfied: The response time is less than or equal to T (e.g., ≤ 100ms).
- Tolerating: The response is between T and 4T (e.g., 101ms to 400ms). These requests are slower than ideal but may be acceptable.
- Frustrated: The response takes longer than 4T (e.g., > 400ms). These are unacceptable response times that directly harm the user experience.
The Apdex score is calculated with a simple formula: (Satisfied Count + (Tolerating Count / 2)) / Total Samples. A score of 1.00 is a perfect score, while anything below 0.50 indicates a majority of frustrated users. Tracking this provides a direct, quantifiable measure of user experience.
Meeting Your Promises with SLA and SLO Tracking
Next up are your commitments. Service Level Agreements (SLAs) are the contractual promises you make to your customers, often guaranteeing a specific level of uptime or performance. Service Level Objectives (SLOs) are the internal engineering targets you set to ensure you meet those SLAs.
For application performance, your SLOs should be specific and measurable:
- 99.9% availability, measured as the percentage of valid requests that do not return a 5xx error over a 28-day rolling window.
- 95% of API requests to the
/api/v1/users/{id}endpoint complete in under 200ms. - The weekly Apdex score for the primary user login flow must remain above 0.90.
Tracking these metrics isn’t just for compliance; it's about building and maintaining trust. A single SLA breach can have direct financial and reputational consequences. This is why SLO monitoring is a core tenet of modern DevOps practices, where performance is a shared responsibility.
Why You Need to Look at System-Level Metrics
User-facing metrics like response time are critical, but they only tell you what is happening, not why. The underlying system metrics are where you'll find the root cause. Digging into CPU, memory, and I/O often reveals the real story behind a performance problem.
The most effective performance optimization strategies connect user-facing latency directly to backend resource consumption. A sudden spike in response time is almost always preceded by a surge in CPU utilization or a slow-burning memory leak from an unclosed resource handle that was invisible until it caused cascading failures.
To truly understand and improve your application's health, it's essential to monitor a combination of key metrics. The following table breaks down the most critical ones and why they should be on your dashboard.
Core Performance Metrics and Their Technical Impact
| Metric | What It Measures | Why It's Critical |
|---|---|---|
| Apdex Score | User satisfaction with response times. | Translates raw performance data into a clear, user-centric score. |
| p95/p99 Response Time | The time taken for 95%/99% of requests to complete. | More valuable than average; exposes the experience of your slowest users. |
| Error Rate | The percentage of requests that result in 5xx errors. | High error rates often signal underlying bugs or infrastructure failures. |
| Throughput | The number of requests processed per minute (RPM). | Measures the application's capacity and scalability under load. |
| CPU Usage | The percentage of CPU being utilized by the application. | High usage can indicate inefficient code (e.g., O(n^2) loops), infinite loops, or resource starvation. |
| Memory Usage | The amount of memory consumed by the application. | Helps identify memory leaks and inefficient data handling that can lead to garbage collection thrashing and crashes. |
By instrumenting your application to capture these fundamental metrics—Apdex, SLOs, response times, CPU, and memory—you create a robust baseline. This data-rich foundation is the essential first step in any successful performance tuning initiative. It ensures your efforts are targeted, effective, and driven by real-world evidence, not just hunches.
Advanced Profiling and Bottleneck Hunting
Alright, you've got your performance baseline. Now the hunt for what’s actually bogging things down begins. This is where we graduate from looking at high-level dashboards to diving deep into the code for serious application performance optimization. The mission is to find the exact functions, database queries, and API calls that are the true performance hogs.
This is how you turn vague complaints like "the app is slow" into actionable engineering tickets. Instead of guessing, you can confidently state, "the processOrder function is spending 85% of its execution time blocked on an unindexed SELECT query against the payments table on line 245 of order_service.py." That precision comes from advanced profiling.
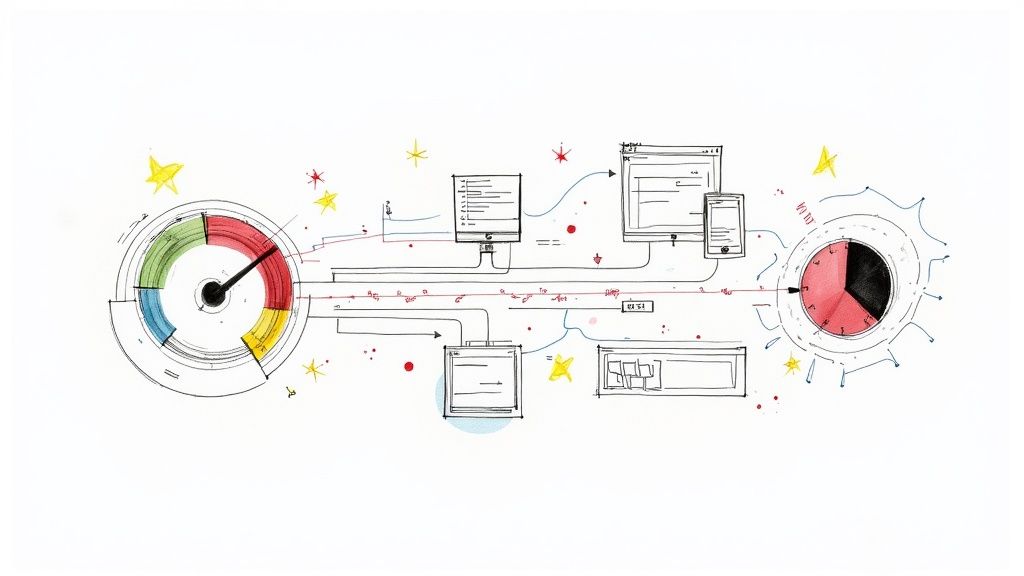
This infographic breaks down the core workflow for tracking down these bottlenecks.
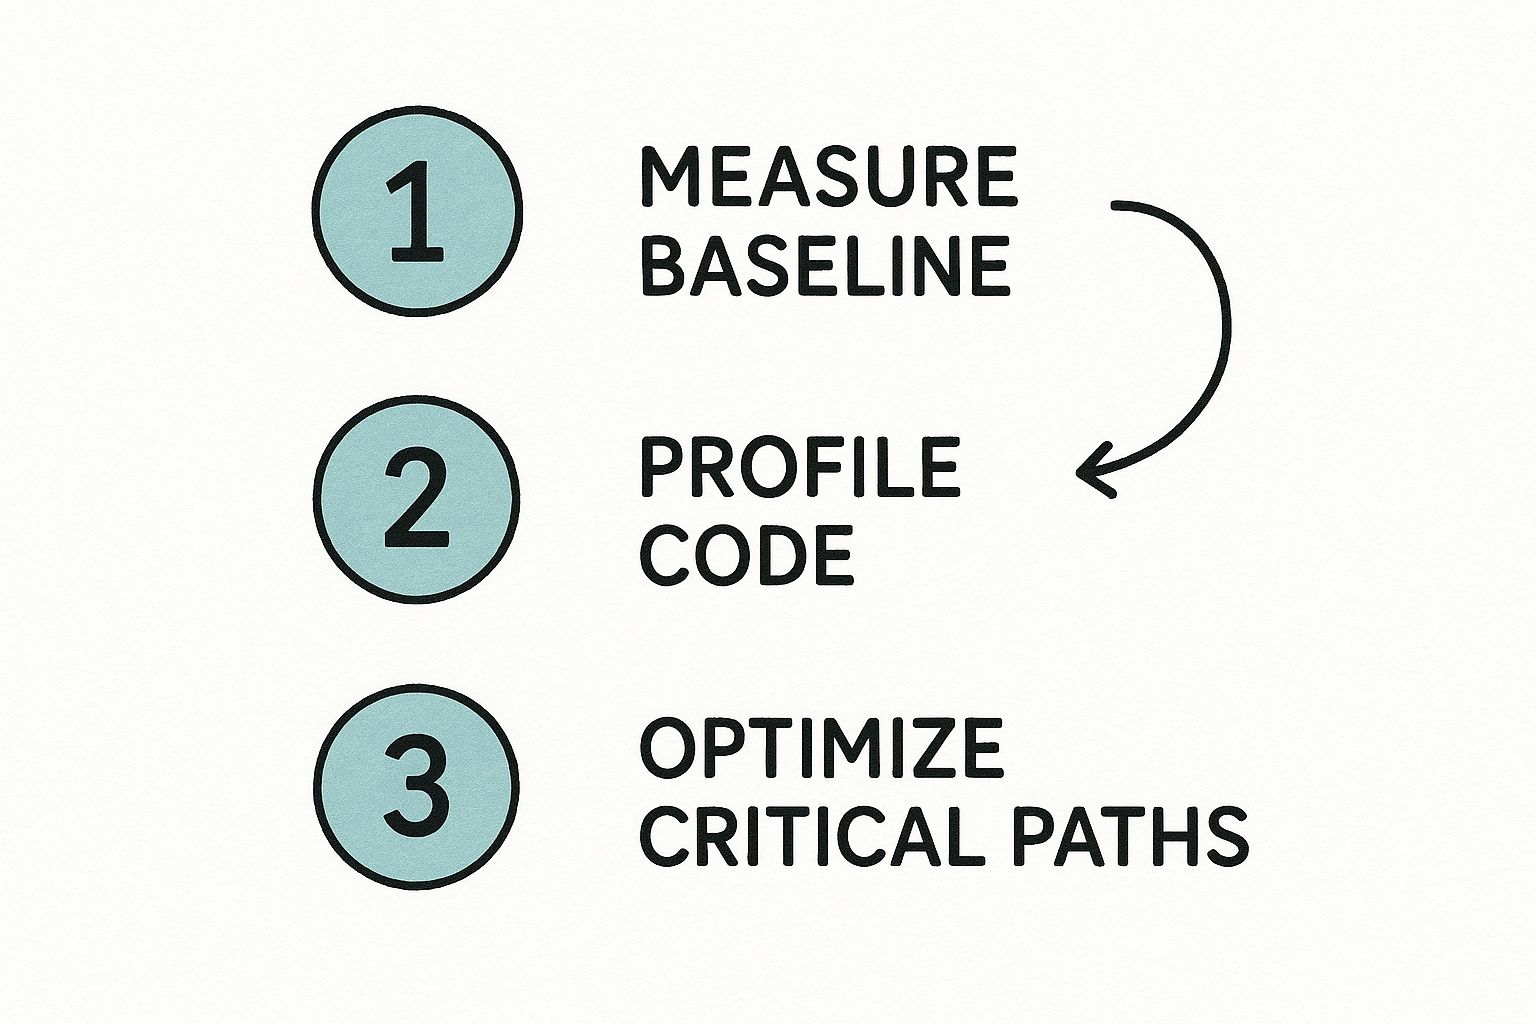
It’s all about a systematic approach: start broad with metrics, use profilers to analyze the code, and then make targeted fixes where they'll have the most impact.
Decoding CPU Usage with Flame Graphs
A code profiler is your best friend in this hunt. It works by sampling your application’s call stack at a high frequency (e.g., 99Hz), building a statistical picture of where CPU time is really going. The most powerful visualization to come out of this process is the flame graph. It gives you a clear, top-down view of your app's execution path.
Each box in the graph represents a function in your call stack. The wider the box, the more CPU time it consumed. These wide, "hot" boxes are the most time-consuming parts of your code. By reading the graph from bottom to top, you can trace the flow and instantly spot which function calls are the most expensive.
For instance, you might see a massive block for a function like generateUserReport. Digging in, you see it calls a data serialization function that's surprisingly wide, telling you an inefficient JSON library is burning CPU cycles on reflection. This is a classic bottleneck that standard monitoring would totally miss.
Uncovering Hidden Database Inefficiencies
Database calls are one of the most common culprits for performance issues. A particularly nasty and hard-to-spot problem is the N+1 query problem. This occurs when your code fetches a list of items (the 1 query) and then loops through that list to fetch related data for each item (the N subsequent queries).
Imagine an ORM fetching 100 blog posts. A naive implementation might run SELECT * FROM posts LIMIT 100, then loop through each post object and trigger post.author() which runs SELECT * FROM users WHERE id = ?. That's 101 round trips to the database! A good Application Performance Monitoring (APM) tool with distributed tracing will light this up, showing a waterfall of identical, repeated SELECT queries.
The fix is often simple—refactor the code to use a single
JOINquery or leverage the ORM's eager loading feature (.includes(:author)in Rails,.select_related('author')in Django). The hard part is spotting the N+1 pattern in the first place, and that's where profilers make all the difference.
Tracing Sluggish API Endpoints
Let’s walk through a real-world scenario. You have a critical API endpoint, /api/v1/products, that keeps blowing past its 200ms SLO. Your basic monitoring confirms it’s slow, but not why.
Here’s how you’d hunt it down:
- Start a trace. Use a distributed tracing tool (like Jaeger or Zipkin) to capture the full journey of a request hitting that endpoint. This trace follows the request across every service it touches, injecting and propagating trace context headers (
traceparent,tracestate). - Analyze the spans. The trace visualizes the request as a series of "spans," with each one representing a specific operation (e.g., an HTTP call, a database query). You'll likely see one very long parent span for the main application logic.
- Find the culprit. Drill into that long span. You might notice it's making several database queries serially instead of in parallel. Or, the trace might reveal a dependency on another microservice that’s taking forever to respond. Understanding these dependencies is key; you can better manage them by studying effective microservices architecture design patterns.
- Pinpoint the root cause. Following the trace into that slow microservice, you find it: a full table scan on a huge, unindexed
productstable. Suddenly, the solution is obvious:CREATE INDEX idx_products_on_category_id ON products (category_id);.
This systematic process—profiling, tracing, and analyzing—is the heart of advanced application performance optimization. It's how you turn mystery slowdowns into solvable engineering problems.
Code-Level and Algorithmic Tuning Strategies
Alright, you've run the profilers and pinpointed the trouble spots. Now it's time to roll up our sleeves and get our hands dirty in the code. This is where we shift from diagnosing problems to actively fixing them—implementing the nitty-gritty, code-level tactics that deliver real, measurable performance improvements.
These strategies are your go-to toolkit for squashing the common performance hogs you found. We're talking about specific coding patterns and architectural tweaks that directly boost speed, responsiveness, and resource utilization.
Implementing Multi-Layered Caching
If you're looking for the biggest bang for your buck, caching is almost always it. It's often the lowest-hanging fruit with the highest impact. The concept is simple: store the results of expensive operations in a faster data store and reuse that result on subsequent requests. A well-designed, multi-layered caching strategy can slash server response times.
Think about your caching approach in layers:
- In-Memory Cache: The fastest option, storing data in your application's heap (e.g., a simple hash map, Guava Cache). It’s perfect for data that's needed constantly with a high read-to-write ratio, like configuration settings or a user's session data.
- Distributed Cache: For horizontally scaled applications, a distributed cache like Redis or Memcached is essential. It provides a shared, low-latency key-value store that all app instances can access, preventing cache inconsistency.
- Content Delivery Network (CDN): A CDN reduces network latency by caching static assets (images, CSS, JavaScript) and dynamic API responses at edge locations physically closer to your users.
Remember, effective caching isn't just about storing data—it's about knowing when to invalidate it. You absolutely must have a clear cache invalidation strategy (e.g., cache-aside, write-through, time-to-live expiration). Failure to do so will inevitably lead to serving stale data.
Offloading Work with Asynchronous Processing
Not every task needs to complete within the synchronous request-response cycle. Long-running, non-critical jobs like sending a welcome email, processing a video upload, or generating a monthly PDF report should not block the main application thread and degrade perceived performance.
This is the perfect use case for asynchronous processing. By using a message queue, powered by tools like RabbitMQ or AWS SQS, you can decouple these tasks from the main request-response path.
The flow is straightforward:
- A user's action triggers a long-running task.
- Instead of executing it immediately, your application serializes a "job" message and pushes it onto a queue.
- You immediately return a
202 Acceptedresponse to the user, like, "Your report is being generated and will be available shortly." - Separate, dedicated worker processes are constantly polling that queue, consuming jobs, and executing them in the background, completely isolated from your user-facing web servers.
This technique is a massive win for perceived performance. The app feels incredibly snappy to the user because the initial response is almost instant, even while heavy lifting happens behind the scenes. It's a non-negotiable strategy for building responsive, scalable systems.
Boosting Algorithmic and Database Efficiency
Sometimes the bottleneck isn't an external service or a slow network call; it's buried deep in your own logic. An inefficient algorithm (e.g., a nested loop with O(n^2) complexity) or a poorly designed database query can bring even the most powerful server to its knees as data volume grows.
This is incredibly true in the mobile world, where code efficiency directly impacts user retention. Applying mobile app performance best practices like refactoring logic and reducing redundant computations can result in a 40% reduction in app launch times. These optimizations can take launch times from a frustrating 5-6 seconds down to a much more acceptable sub-2 seconds—a critical difference for keeping users engaged. You can read the full breakdown on Finextra to see how developers are tackling this.
Here are a few technical patterns to look for and fix:
- Memoization: A specific form of caching where you store the results of expensive, deterministic function calls. The next time the function is called with the same inputs, you return the cached result instead of re-computing. It’s fantastic for pure functions, like those performing complex financial calculations.
- Database Connection Pooling: Opening a new TCP connection to a database for every query is extremely slow and resource-intensive. A connection pool (like HikariCP for Java or PgBouncer for PostgreSQL) solves this by maintaining a set of open, ready-to-use connections. Your application borrows one when needed and returns it when done, amortizing the connection setup cost over many queries.
- Effective Index Utilization: We touched on this during profiling, but it’s critical. Ensure your queries are using database indexes. Running an
EXPLAIN ANALYZEon a slow query will show you the query plan and reveal if you're doing a full table scan. Add indexes to columns used in yourWHERE,JOIN, andORDER BYclauses to enable fast lookups.
By combining strategic caching, asynchronous processing, and deep analysis of your algorithms and data access patterns, you can systematically dismantle performance bottlenecks at their source.
Optimizing The Front End For Perceived Speed
You can have a perfectly tuned backend and an API that responds in less than 20ms, but none of that matters if the user's browser takes seconds to render the page. The front end is where performance becomes tangible, and the user's perception of speed is the ultimate metric.
This is about mastering the user-facing experience. Let's get into the technical details of conquering Google's Core Web Vitals, shrinking asset payloads, and optimizing the browser's rendering path.
Mastering The Core Web Vitals
Your primary targets on the front end are the Core Web Vitals. These three metrics are Google's attempt to quantify real-world user experience, and they directly impact your search rankings.
- Largest Contentful Paint (LCP): Measures loading performance. To improve it, ensure the largest element in the viewport (often a hero image or H1 tag) is rendered quickly. Preloading critical resources (
<link rel="preload">) is a key technique here. - Interaction to Next Paint (INP): Measures interactivity. It tracks the latency from a user interaction (like a click) to the next visual update. A low INP requires breaking up long-running JavaScript tasks on the main thread so the browser can respond to input.
- Cumulative Layout Shift (CLS): Measures visual stability. It quantifies unexpected layout shifts during load. To fix this, always specify
widthandheightattributes on images and reserve space for dynamic content like ads.
To truly optimize these, you need to be analyzing Real User Monitoring (RUM) data. Lab tests (like Lighthouse) are a great starting point, but RUM shows you what’s actually happening for your users on their diverse devices and networks.
Shrinking Payloads With Bundling and Minification
On the front end, every byte counts. Your first line of defense against slow load times is bundling and minification.
Bundling combines multiple JavaScript or CSS files into a single file, reducing the number of round-trip HTTP requests. Minification then removes unnecessary characters from that code (whitespace, comments, shortening variable names) without altering its functionality. Modern build tools like Webpack or Vite automate this process.
But simply creating a single massive app.js can be counterproductive.
Code splitting is the essential next step. Instead of one monolithic bundle, you break your code into smaller, logical chunks that are loaded on demand. For example, the code for a complex admin dashboard doesn't need to be downloaded by a user visiting the landing page. Route-based splitting is a common and effective pattern.
By loading only what's necessary for the initial view, you dramatically speed up that critical first paint and improve your LCP score.
Front-End Optimization Technique Breakdown
Choosing the right optimization technique often involves a trade-off between implementation complexity and impact. Here’s a technical breakdown to help you prioritize.
| Technique | Impact Level (Low/Med/High) | Implementation Complexity | Best For |
|---|---|---|---|
| Minification | Medium | Low | All projects; a foundational, automated win via build tools. |
| Image Compression | High | Low | Sites with many raster images; use modern formats like WebP or AVIF. |
| Lazy Loading | High | Low | Pages with content below the fold. Use loading="lazy" for images/iframes. |
| Bundling | Medium | Low | Modern JavaScript applications using frameworks and modules. |
| Code Splitting | High | Medium | Single Page Applications (SPAs) with distinct routes or features. |
| Inlining Critical CSS | High | Medium | Improving Time to First Paint (TTFP) for content-heavy sites. |
This table isn't exhaustive, but it provides a clear path. Start with low-hanging fruit like minification and lazy loading, then move on to more complex strategies like code splitting as your application grows.
Optimizing The Critical Rendering Path
The critical rendering path refers to the sequence of steps a browser takes to convert HTML, CSS, and JavaScript into pixels on the screen. Optimizing this path is key to making a site feel instantaneous.
A powerful strategy is identifying your "critical CSS"—the minimum set of styles needed to render the above-the-fold content. You can then inline this small block of CSS directly into the <head> of your HTML document.
This allows the browser to start rendering the visible part of the page immediately, without being render-blocked by the download of an external stylesheet. The rest of your styles can then be loaded asynchronously.
We're also seeing a shift toward using AI to anticipate performance issues. Some businesses are using predictive preloading, where AI analyzes user navigation patterns to prefetch resources for pages a user is likely to visit next. This can lead to a 20-30% uplift in engagement. As you can read in more detail in these 2025 web performance trends on UXify, tools like Google's Chrome AI Performance Panel are giving developers new ways to diagnose bottlenecks before they impact users.
And don't forget lazy loading. Any assets that are offscreen—like images far down a long article—shouldn't be loaded initially. Simply add the loading="lazy" attribute to your <img> and <iframe> tags, and the browser will defer loading them until the user scrolls them into the viewport. It's a simple, high-impact change.
Weaving Performance Into Your DevOps Workflow
True application performance optimization isn’t a one-time project. It's a discipline that must be woven into the fabric of your software development lifecycle. If you're only thinking about performance when users complain, you're already behind.
The goal is to shift performance left, embedding it deep into your CI/CD pipeline and engineering culture. This moves you from reactive firefighting to a proactive, continuous practice. You must catch performance regressions automatically, before they ever reach production.
Build Automated Performance Gates
The most effective way to enforce performance standards is to automate them within your delivery process. Your CI/CD pipeline is the ideal place for this. Implement "performance gates"—automated checks that run on every build, treating a performance regression with the same severity as a failing unit test.
This starts by integrating performance testing tools directly into your CI pipeline. For every pull request, your CI server should automatically run a suite of targeted performance tests against an ephemeral test environment. These aren't multi-hour load tests, but quick, focused checks designed to detect regressions fast.
You can configure tools like k6 or JMeter to run a script that hits key endpoints with a realistic traffic pattern. Your pipeline script then asserts that key metrics—like p95 response time or requests per second—are within an acceptable delta of the baseline. If the new code causes a statistically significant slowdown, the pipeline fails the build, providing immediate feedback to the developer.
Enforce Strict Performance Budgets
A performance gate is only as strong as its thresholds. This is where a performance budget comes in. This is a set of hard, non-negotiable limits on key metrics that your application is never allowed to exceed in a CI build.
If a build violates the budget, it fails. No exceptions.
Your budget should be comprehensive, covering the full stack:
- Front End: A hard cap on JavaScript bundle size (e.g., < 250KB gzipped), LCP under 2.5 seconds, and a CLS score below 0.1 in lab tests.
- Back End: API endpoint p99 response times must remain under 400ms, or an Apdex score that never dips below 0.95.
- Infrastructure: Maximum memory allocation for a specific microservice container or a firm ceiling on CPU cycles per transaction.
Setting a performance budget changes the engineering conversation. It forces developers to consider the performance impact of a new library or feature during development, not after a production incident. Performance becomes a first-class requirement for every pull request.
Create a Culture of Performance Ownership
Tools and automation are essential, but they are ineffective without a culture where every engineer feels responsible for performance. You must move past the "ops will deal with it" mentality. The new mantra is, "my code's performance is my responsibility."
Two practices are key to this cultural shift. First, integrate your Application Performance Monitoring (APM) tool with your deployment workflow. When a new version goes live, the CI/CD pipeline should automatically send a deployment marker event to your APM. This lets you immediately correlate changes in performance metrics—good or bad—to a specific commit hash and release. For a deeper look at this automation, our guide on CI/CD pipeline best practices has valuable strategies.
Second, use feature flags for high-risk rollouts. By wrapping new, performance-intensive features in a flag, you can deploy them to production while they are still "off." You can then progressively enable the feature for a small percentage of users, carefully monitoring its real-world impact on your dashboards. If performance degrades, you disable the feature with a single click, mitigating the blast radius. This tight feedback loop—deploy, measure, learn—is the essence of a modern, performance-aware DevOps workflow.
Alright, even with a solid game plan, jumping into application performance optimization can feel daunting. I've seen teams get blocked by the same questions that kill momentum before they even start.
Let's cut through the noise and tackle these head-on. Getting these answers straight from the beginning is how you ensure your engineering work drives business value.
How Do I Know Where to Start Optimizing?
This is the critical question. The single biggest mistake is guessing. Never start optimizing based on a hunch.
Your starting point must be driven by data from your monitoring and profiling tools.
Here’s a prioritization matrix I always use:
- Highest Latency Endpoints (p95/p99): Which API calls or pages have the worst tail latency? These cause acute pain for users, even if they're a minority.
- Highest Throughput Endpoints: Find the endpoint that gets hit thousands of times a minute. A small, 10ms improvement here can have a massive aggregate impact, freeing up significant system resources.
- Endpoints with High Error Rates: Performance issues and application errors are often correlated. A service with a high 5xx error rate is a prime candidate for investigation.
Use this data to build a prioritized backlog. The ideal starting point is a high-throughput endpoint with poor p95 latency where your profiler has already identified a likely culprit, like an N+1 query.
How Much Performance Improvement Is "Good Enough"?
The answer is not a universal number like "200ms." The real answer is: it depends on the context defined by your SLOs.
A background job that processes nightly analytics can take several minutes, and no one will care. But a payment processing API must have a p99 latency in the low milliseconds. You cannot define "good enough" without a pre-established objective.
Instead of chasing an arbitrary target, set specific SLOs for each critical user journey. For an e-commerce checkout flow, you might aim for a sub-2-second end-to-end completion time. For an internal dashboard, 5 seconds might be acceptable.
Your work is "good enough" when your application is consistently meeting or exceeding its defined SLOs.
How Do I Justify the Investment in Performance Work?
This requires translating engineering metrics into business outcomes. Performance is not just a technical feature; it's a core business driver. You justify the investment by connecting your work to revenue, cost, and user satisfaction.
Stop talking about milliseconds. Start talking about business impact.
Build your business case with data you likely already have:
- Conversion Rates: Correlate page load times with conversion funnels. "A one-second improvement in LCP is projected to increase checkout conversions by 7%, which translates to $X in new revenue."
- Infrastructure Costs: Show how code optimization directly reduces your cloud spend. "Fixing this memory leak will allow us to reduce our EKS node count by 20%, saving $5,000 per month in AWS costs."
- User Retention and Churn: Use your Apdex scores and analytics to demonstrate that poor performance leads to user churn. Connect your optimization efforts directly to improving key product metrics like Daily Active Users (DAU).
When you frame application performance optimization as a driver of revenue and a mitigator of cost, securing engineering time and resources becomes a straightforward business decision. It’s no longer a "cost center"—it’s a clear investment in the health of the business.
Ready to build a high-performing, resilient system? OpsMoon connects you with the top 0.7% of DevOps experts who can help you implement robust monitoring, automate your CI/CD pipelines, and instill a culture of performance. Plan your work for free and see how we can help you ship faster and more reliably.