10 Technical Kubernetes Monitoring Best Practices for 2026
 By opsmoon
Discover 10 actionable Kubernetes monitoring best practices. Master metrics, logs, tracing, SLOs, and security for robust and cost-effective clusters.
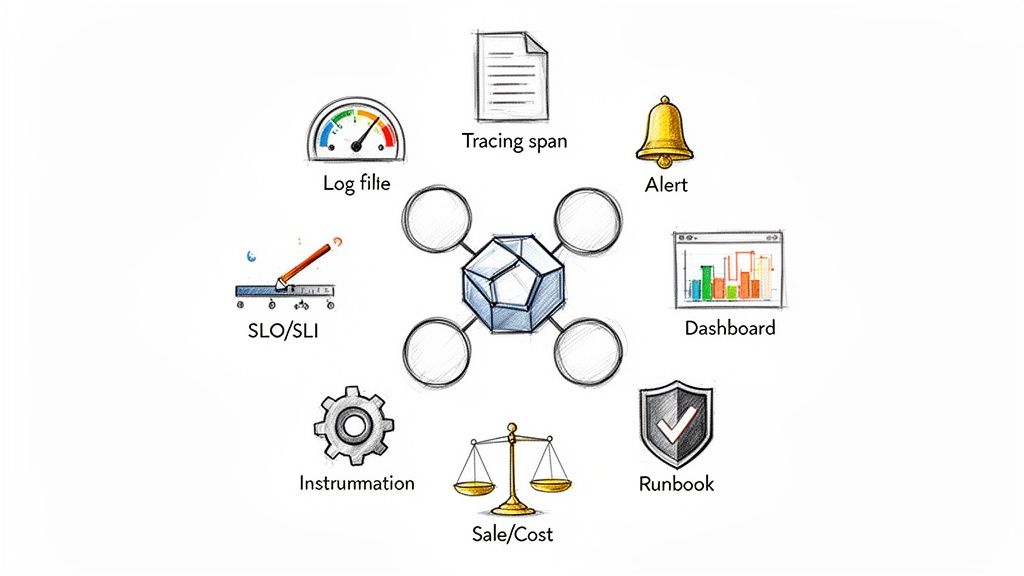
In modern cloud-native environments, simply knowing if a pod is 'up' or 'down' is insufficient. True operational excellence demands deep, actionable insights into every layer of the Kubernetes stack, from the control plane and nodes to individual application transactions. This guide moves beyond surface-level advice to provide a technical, actionable roundup of 10 essential Kubernetes monitoring best practices that high-performing SRE and DevOps teams implement. We will cover the specific tools, configurations, and philosophies needed to build a resilient, performant, and cost-efficient system.
This article is designed for engineers and technical leaders who need to move beyond reactive firefighting. We will dive deep into practical implementation details, providing specific code snippets, PromQL queries, and real-world examples to make these strategies immediately applicable to your infrastructure. You won't find generic tips here; instead, you will get a comprehensive blueprint for operationalizing a robust observability stack.
Whether you're managing a single cluster or a global fleet, these practices will help you transition to a model of proactive optimization. We will explore how to:
- Go beyond basic metrics with comprehensive collection using Prometheus and custom application-level instrumentation.
- Establish end-to-end visibility by correlating metrics, logs, and distributed traces.
- Define what matters by creating and monitoring Service Level Objectives (SLOs) as first-class citizens.
- Integrate security into your observability strategy by monitoring network policies and container image supply chains.
By implementing these advanced Kubernetes monitoring best practices, you can ensure your services not only remain available but also consistently meet user expectations and critical business goals. Let's dive into the technical details.
1. Implement Comprehensive Metrics Collection with Prometheus
Prometheus has become the de facto standard for metrics collection in the cloud-native ecosystem, making it an indispensable tool in any Kubernetes monitoring best practices playbook. It operates on a pull-based model, scraping time-series data from configured endpoints on applications, infrastructure components, and the Kubernetes API server itself. This data provides the raw material needed to understand cluster health, application performance, and resource utilization, forming the foundation of a robust observability strategy.
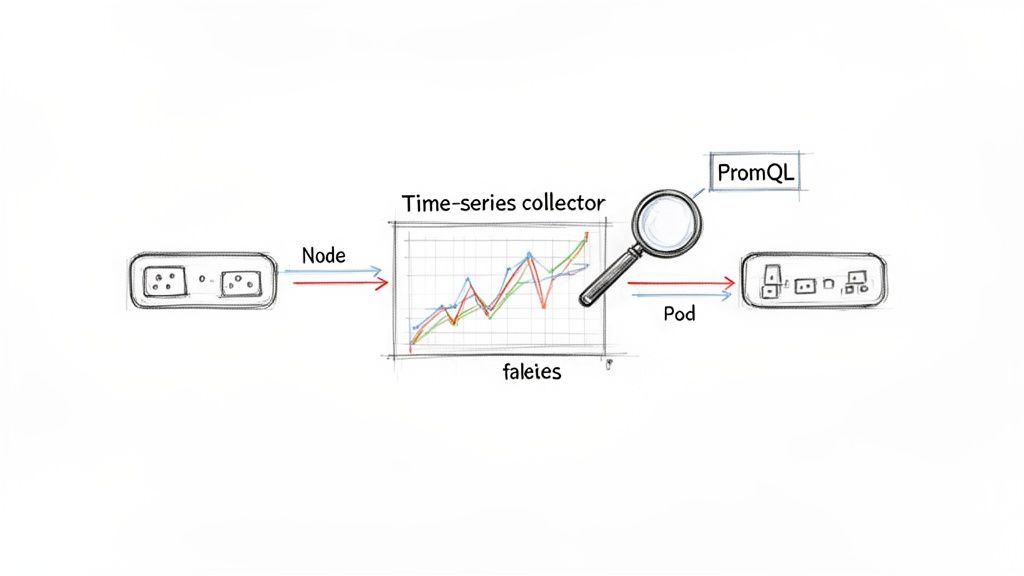
This approach, inspired by Google's internal Borgmon system, allows DevOps and SRE teams to proactively detect issues before they impact end-users. For instance, a SaaS platform can monitor thousands of pod deployments across multiple clusters, while a platform team can track the resource consumption of CI/CD pipeline infrastructure. The power lies in PromQL, a flexible query language that enables complex analysis and aggregation of metrics to create meaningful alerts and dashboards.
Actionable Implementation Tips
To effectively leverage Prometheus, move beyond the default setup with these targeted configurations:
-
Configure Scrape Intervals: In your
prometheus.ymlor Prometheus Operator configuration, set appropriate scrape intervals. A 15s interval offers a good balance for most services, while critical components like the API server might benefit from 5s.global: scrape_interval: 15s scrape_configs: - job_name: 'kubernetes-apiservers' scrape_interval: 5s -
Use Declarative Configuration: Leverage
ServiceMonitorandPodMonitorCustom Resource Definitions (CRDs) provided by the Prometheus Operator. This automates scrape target discovery. For example, to monitor any service with the labelapp.kubernetes.io/name: my-app, you would apply:apiVersion: monitoring.coreos.com/v1 kind: ServiceMonitor metadata: name: my-app-monitor labels: release: prometheus spec: selector: matchLabels: app.kubernetes.io/name: my-app endpoints: - port: webFor a deep dive, explore how to set up Prometheus service monitoring.
-
Manage Cardinality and Retention: High cardinality can rapidly increase storage costs. Use PromQL recording rules to pre-aggregate metrics. For instance, to aggregate HTTP requests per path into requests per service, you could create a rule:
# In your Prometheus rules file groups: - name: service_rules rules: - record: service:http_requests_total:rate1m expr: sum by (job, namespace) (rate(http_requests_total[1m])) -
Implement Long-Term Storage: For long-term data retention, integrate a remote storage backend like Thanos or Cortex. This involves configuring
remote_writein your Prometheus setup to send metrics to the remote endpoint.# In prometheus.yml remote_write: - url: "http://thanos-receive.monitoring.svc.cluster.local:19291/api/v1/receive"
2. Centralize Logs with a Production-Grade Log Aggregation Stack
In a distributed Kubernetes environment, ephemeral containers across numerous nodes constantly generate logs. Without a central repository, troubleshooting becomes a fragmented and inefficient process of manually accessing individual containers. Centralizing these logs using a production-grade stack like EFK (Elasticsearch, Fluentd, Kibana), Loki, or Splunk is a critical component of any effective Kubernetes monitoring best practices strategy. This approach aggregates disparate log streams into a single, searchable, and analyzable datastore, enabling rapid root cause analysis, security auditing, and compliance reporting.
This centralized model transforms logs from a passive record into an active intelligence source. For instance, an e-commerce platform can correlate logs from payment, inventory, and shipping microservices to rapidly trace a failing customer transaction. Similarly, a FinTech company might leverage Splunk to meet strict regulatory requirements by creating auditable trails of all financial operations. For teams seeking a more cost-effective, Kubernetes-native solution, Grafana Loki offers a lightweight alternative that integrates seamlessly with Prometheus and Grafana dashboards.
Actionable Implementation Tips
To build a robust and scalable log aggregation pipeline, focus on these technical best practices:
-
Deploy Collectors as a DaemonSet: Use a
DaemonSetto deploy your log collection agent (e.g., Fluentd, Fluent Bit, or Promtail) to every node in the cluster. This guarantees that logs from all pods on every node are captured automatically without manual intervention.# Example DaemonSet manifest snippet apiVersion: apps/v1 kind: DaemonSet metadata: name: fluent-bit spec: template: spec: containers: - name: fluent-bit image: fluent/fluent-bit:latest volumeMounts: - name: varlog mountPath: /var/log -
Structure Logs as JSON: Instrument your applications to output logs in a structured JSON format. This practice eliminates the need for complex and brittle regex parsing. For example, in a Python application using the standard logging library:
import logging import json class JsonFormatter(logging.Formatter): def format(self, record): log_record = { "timestamp": self.formatTime(record, self.datefmt), "level": record.levelname, "message": record.getMessage(), "trace_id": getattr(record, 'trace_id', None) } return json.dumps(log_record) -
Implement Log Retention Policies: Configure retention policies in your log backend. In Elasticsearch, use Index Lifecycle Management (ILM) to define hot, warm, and cold phases, eventually deleting old data.
// Example ILM Policy
{
  "policy": {
    "phases": {
      "hot": { "min_age": "0ms", "actions": { "rollover": { "max_age": "7d" }}},
      "delete": { "min_age": "30d", "actions": { "delete": {}}}
    }
  }
}
For a deeper dive, explore these log management best practices.
-
Isolate Environments and Applications: Use separate indices in Elasticsearch or tenants in Loki. With Fluentd, you can dynamically route logs to different indices based on Kubernetes metadata:
<!-- Fluentd configuration to route logs -->
<match kubernetes.var.log.containers.**>
  @type elasticsearch
  host elasticsearch.logging.svc.cluster.local
  port 9200
  logstash_format true
  logstash_prefix ${tag_parts[3]} # Uses namespace as index prefix
</match>
3. Establish Distributed Tracing for End-to-End Visibility
While metrics and logs provide isolated snapshots of system behavior, distributed tracing is what weaves them into a cohesive narrative. It captures the entire lifecycle of a request as it traverses multiple microservices, revealing latency, critical dependencies, and hidden failure points. Solutions like Jaeger and OpenTelemetry instrument applications to trace execution paths, visualizing performance bottlenecks and complex interaction patterns that other observability pillars cannot surface on their own.
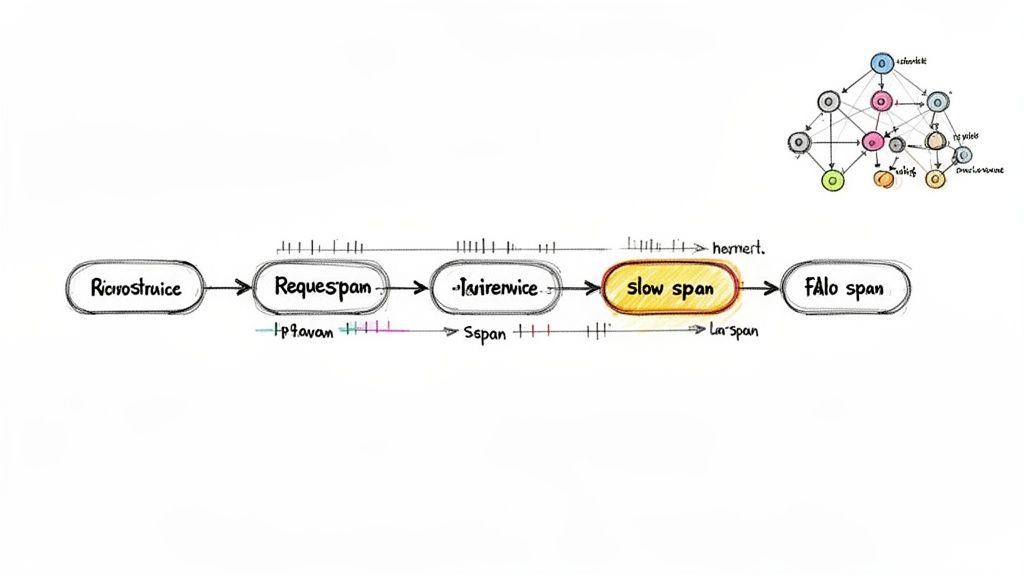
This end-to-end visibility is non-negotiable for debugging modern microservice architectures. For instance, a payment processor can trace a single transaction from the user's initial API call through fraud detection, banking integrations, and final confirmation services to pinpoint exactly where delays occur. This capability transforms debugging from a process of guesswork into a data-driven investigation, making it a cornerstone of effective Kubernetes monitoring best practices.
Actionable Implementation Tips
To integrate distributed tracing without overwhelming your systems or teams, adopt a strategic approach:
-
Implement Head-Based Sampling: Configure your OpenTelemetry SDK or agent to sample a percentage of traces. For example, in the OpenTelemetry Collector, you can use the
probabilisticsamplerprocessor:processors: probabilistic_sampler: sampling_percentage: 15 service: pipelines: traces: processors: [probabilistic_sampler, ...]This samples 15% of traces, providing sufficient data for analysis without the burden of 100% collection.
-
Standardize on W3C Trace Context: Ensure your instrumentation libraries are configured to use W3C Trace Context for propagation. Most modern SDKs, like OpenTelemetry, use this by default. This ensures trace IDs are passed via standard HTTP headers (
traceparent,tracestate), allowing different services to participate in the same trace. -
Start with Critical User Journeys: Instead of attempting to instrument every service at once, focus on your most critical business transactions first. Instrument the entrypoint service (e.g., API Gateway) and the next two downstream services in a critical path like user authentication or checkout. This provides immediate, high-value visibility.
-
Correlate Traces with Logs and Metrics: Enrich your structured logs with
trace_idandspan_id. When using an OpenTelemetry SDK, you can automatically inject this context into your logging framework. This allows you to construct a direct URL from your tracing UI (Jaeger) to your logging UI (Kibana/Grafana) using the trace ID. For example, a link in Jaeger could look like:https://logs.mycompany.com/app/discover#/?_q=(query:'trace.id:"${trace.traceID}"').
4. Monitor Container Resource Utilization and Implement Resource Requests/Limits
Kubernetes resource requests and limits are foundational for ensuring workload stability and cost efficiency. Requests guarantee a minimum amount of CPU and memory for a container, while limits cap its maximum consumption. Monitoring actual utilization against these defined thresholds is a critical component of Kubernetes monitoring best practices, as it prevents resource starvation, identifies inefficient over-provisioning, and provides the data needed for continuous optimization.
This practice allows platform teams to shift from guesswork to data-driven resource allocation. For example, a SaaS company can analyze utilization metrics to discover they are over-provisioning development environments by 40%, leading to immediate and significant cost savings. Similarly, a team managing batch processing jobs can use this data to right-size pods for varying workloads, ensuring performance without wasting resources. The core principle is to close the feedback loop between declared resource needs and actual consumption.
Actionable Implementation Tips
To master resource management, integrate monitoring directly into your allocation strategy with these techniques:
-
Establish a Baseline: Set initial requests and limits in your deployment manifests. A common starting point is to set requests equal to limits to guarantee QoS (
Guaranteedclass).resources: requests: memory: "256Mi" cpu: "250m" limits: memory: "256Mi" cpu: "250m"Then monitor actual usage with PromQL:
sum(rate(container_cpu_usage_seconds_total{pod="my-pod"}[5m])) -
Leverage Automated Tooling: Deploy the Kubernetes
metrics-serverto collect baseline resource metrics. For more advanced, data-driven recommendations, implement the Vertical Pod Autoscaler (VPA) in "recommendation" mode. It will analyze usage and create a VPA object with suggested values.# VPA recommendation output status: recommendation: containerRecommendations: - containerName: my-app target: cpu: "150m" memory: "200Mi" -
Implement Proactive Autoscaling: Configure the Horizontal Pod Autoscaler (HPA) based on resource utilization. To scale when average CPU usage across pods exceeds 80%, apply this manifest:
apiVersion: autoscaling/v2 kind: HorizontalPodAutoscaler metadata: name: my-app-hpa spec: scaleTargetRef: apiVersion: apps/v1 kind: Deployment name: my-app minReplicas: 2 maxReplicas: 10 metrics: - type: Resource resource: name: cpu target: type: Utilization averageUtilization: 80 -
Conduct Regular Reviews: Institute a quarterly review process. Use PromQL queries to identify over-provisioned (
avg_over_time(kube_pod_container_resource_requests{resource="cpu"}[30d]) / avg_over_time(container_cpu_usage_seconds_total[30d]) > 3) or under-provisioned (sum(kube_pod_container_status_restarts_total) > 0) workloads. -
Protect Critical Workloads: Use Kubernetes PriorityClasses. First, define a high-priority class:
apiVersion: scheduling.k8s.io/v1
kind: PriorityClass
metadata:
  name: high-priority
value: 1000000
globalDefault: false
description: "This priority class should be used for critical service pods."
Then, assign it to your critical pods using
priorityClassName: high-priorityin the pod spec.
5. Design Alerting Strategies with Alert Fatigue Prevention
An undisciplined alerting strategy quickly creates a high-noise environment where critical signals are lost. This leads to "alert fatigue," causing on-call engineers to ignore legitimate warnings and defeating the core purpose of a monitoring system. Effective alerting, a cornerstone of Kubernetes monitoring best practices, shifts focus from low-level infrastructure minutiae to actionable, user-impacting symptoms, ensuring that every notification warrants immediate attention.
This philosophy, championed by Google's SRE principles and tools like Alertmanager, transforms alerting from a constant distraction into a valuable incident response trigger. For instance, an e-commerce platform can move from dozens of daily CPU or memory warnings to just a handful of critical alerts tied to checkout failures or slow product page loads. The goal is to make every alert meaningful by tying it directly to service health and providing the context needed for rapid remediation.
Actionable Implementation Tips
To build a robust and low-noise alerting system, adopt these strategic practices:
- Alert on Symptoms, Not Causes: Instead of a generic CPU alert, create a PromQL alert that measures user-facing latency. This query alerts if the 95th percentile latency for a service exceeds 500ms for 5 minutes:
# alert: HighRequestLatency expr: histogram_quantile(0.95, sum(rate(http_request_duration_seconds_bucket[5m])) by (le, job)) > 0.5 for: 5m - Use Multi-Condition and Time-Based Alerts: Configure alerts to fire only when multiple conditions are met over a sustained period. The
forclause in Prometheus is crucial. The example above usesfor: 5mto prevent alerts from transient spikes. - Implement Context-Aware Routing and Escalation: Use Alertmanager's routing tree to send alerts to the right team. This
alertmanager.ymlsnippet routes alerts with the labelteam: paymentsto a specific Slack channel.route: group_by: ['alertname', 'cluster'] receiver: 'default-receiver' routes: - receiver: 'slack-payments-team' match: team: 'payments' receivers: - name: 'slack-payments-team' slack_configs: - channel: '#payments-oncall' - Enrich Alerts with Runbooks: Embed links to diagnostic dashboards and runbooks directly in the alert's annotations using Go templating in your alert definition.
annotations: summary: "High request latency on {{ $labels.job }}" runbook_url: "https://wiki.mycompany.com/runbooks/{{ $labels.job }}" dashboard_url: "https://grafana.mycompany.com/d/xyz?var-job={{ $labels.job }}" - Track Alert Effectiveness: Use the
alertmanager_alerts_received_totalandalertmanager_alerts_invalid_totalmetrics exposed by Alertmanager to calculate a signal-to-noise ratio. If the invalid count is high, your alert thresholds are too sensitive.
6. Implement Network Policy Monitoring and Security Observability
Network policies are the firewalls of Kubernetes, defining which pods can communicate with each other. While essential for segmentation, they are ineffective without continuous monitoring. Security observability bridges this gap by providing deep visibility into network flows, connection attempts, and policy violations. This practice transforms network policies from static rules into a dynamic, auditable security control, crucial for detecting lateral movement and unauthorized access within the cluster.
This layer of monitoring is fundamental to a mature Kubernetes security posture. For example, a financial services platform can analyze egress traffic patterns to detect and block cryptocurrency mining malware attempting to communicate with external command-and-control servers. Similarly, a healthcare organization can monitor and audit traffic to ensure that only authorized services access pods containing protected health information (PHI), thereby enforcing HIPAA compliance. These real-world applications demonstrate how network monitoring shifts security from a reactive to a proactive discipline.
Actionable Implementation Tips
To effectively integrate security observability into your Kubernetes monitoring best practices, focus on these tactical implementations:
- Establish a Traffic Baseline: Before enabling alerts, use a tool like Cilium's Hubble UI to visualize network flows. Observe normal communication patterns for a week to understand which services communicate over which ports. This baseline is critical for writing accurate network policies and identifying anomalies.
- Use Policy-Aware Tooling: Leverage eBPF-based tools like Cilium or network policy engines like Calico. For instance, Cilium provides Prometheus metrics like
cilium_policy_verdicts_total. You can create an alert for a sudden spike indropverdicts:# alert: HighNumberOfDroppedPackets expr: sum(rate(cilium_policy_verdicts_total{verdict="drop"}[5m])) > 100 - Enable Flow Logging Strategically: In Cilium, you can enable Hubble to capture and log network flows. To avoid data overload, configure it to only log denied connections or traffic to sensitive pods by applying specific
HubbleCRDs. This reduces storage costs while still capturing high-value security events. For a deeper understanding of securing your cluster, review these Kubernetes security best practices. - Correlate Network and Security Events: Integrate network flow data with runtime security tools like Falco. A Falco rule can detect a suspicious network connection originating from a process that spawned from a web server, a common attack pattern.
# Example Falco rule
- rule: Web Server Spawns Shell
  desc: Detect a shell spawned from a web server process.
  condition: proc.name = "httpd" and spawn_process and shell_procs
  output: "Shell spawned from web server (user=%user.name command=%proc.cmdline)"
  priority: WARNING
Correlating this with a denied egress flow from that same pod provides a high-fidelity alert. To further strengthen your Kubernetes environment, exploring comprehensive application security best practices can provide valuable insights for protecting your deployments.
7. Establish SLOs/SLIs and Monitor Them as First-Class Metrics
Moving beyond raw infrastructure metrics, Service Level Objectives (SLOs) and Service Level Indicators (SLIs) provide a user-centric framework for measuring reliability. SLIs are the direct measurements of a service's performance (e.g., p95 latency), while SLOs are the target thresholds for those SLIs over a specific period (e.g., 99.9% of requests served in under 200ms). This practice connects technical performance directly to business outcomes, transforming monitoring from a reactive operational task into a strategic enabler.
This framework, popularized by Google's Site Reliability Engineering (SRE) practices, helps teams make data-driven decisions about risk and feature velocity. For instance, Stripe famously uses SLO burn rates to automatically halt deployments when reliability targets are threatened. This approach ensures that one of the core Kubernetes monitoring best practices is not just about tracking CPU usage but about quantifying user happiness and system reliability in a language that both engineers and business stakeholders understand.
Actionable Implementation Tips
To effectively implement SLOs and SLIs, integrate them deeply into your monitoring and development lifecycle:
- Start Small and Iterate: Begin by defining one availability SLI and one latency SLI for a critical service.
- Availability SLI (request-based):
(total good requests / total requests) * 100 - Latency SLI (request-based):
(total requests served under X ms / total valid requests) * 100
- Availability SLI (request-based):
- Define with Historical Data: Use PromQL to analyze historical performance. To find the p95 latency over the last 30 days to set a realistic target, use:
histogram_quantile(0.95, sum(rate(http_request_duration_seconds_bucket[30d])) by (le)) - Visualize and Track Error Budgets: An SLO of 99.9% over 30 days means you have an error budget of
(1 - 0.999) * 30 * 24 * 60 = 43.2 minutesof downtime. Use Grafana to plot this budget, showing how much is remaining for the current period. - Alert on Burn Rate: Alert when the error budget is being consumed too quickly. This PromQL query alerts if you are on track to exhaust your monthly budget in just 2 days (a burn rate of 15x):
# alert: HighErrorBudgetBurn expr: (sum(rate(http_requests_total{code=~"5.."}[1h])) / sum(rate(http_requests_total[1h]))) > (15 * (1 - 0.999)) - Review and Adjust Periodically: Hold quarterly reviews to assess if SLOs are still relevant. If you consistently meet an SLO with 100% of your error budget remaining, the target may be too loose. If you constantly violate it, it may be too aggressive or signal a real reliability problem that needs investment.
8. Monitor and Secure Container Image Supply Chain
Container images are the fundamental deployment artifacts in Kubernetes, making their integrity a critical security and operational concern. Monitoring the container image supply chain involves tracking images from build to deployment, ensuring they are free from known vulnerabilities and configured securely. This "shift-left" approach integrates security directly into the development lifecycle, preventing vulnerable or malicious images from ever reaching a production cluster.
This practice is essential for any organization adopting Kubernetes monitoring best practices, as a compromised container can undermine all other infrastructure safeguards. For example, a DevOps team can use tools like cosign to cryptographically sign images, ensuring their provenance and preventing tampering. Meanwhile, security teams can block deployments of images containing critical CVEs, preventing widespread exploits before they happen and maintaining a secure operational posture.
Actionable Implementation Tips
To effectively secure your container image pipeline, implement these targeted strategies:
- Integrate Scanning into CI/CD: Add a scanning step to your pipeline. In a GitHub Actions workflow, you can use Trivy to scan an image and fail the build if critical vulnerabilities are found:
- name: Scan image for vulnerabilities uses: aquasecurity/trivy-action@master with: image-ref: 'your-registry/your-image:latest' format: 'table' exit-code: '1' ignore-unfixed: true vuln-type: 'os,library' severity: 'CRITICAL,HIGH' - Use Private Registries and Policy Enforcement: Utilize private container registries like Harbor or Artifactory. Then, use an admission controller like Kyverno to enforce policies. This Kyverno policy blocks any image not from your trusted registry:
apiVersion: kyverno.io/v1 kind: ClusterPolicy metadata: name: restrict-image-registries spec: validationFailureAction: enforce rules: - name: validate-registries match: resources: kinds: - Pod validate: message: "Only images from my-trusted-registry.io are allowed." pattern: spec: containers: - image: "my-trusted-registry.io/*" - Schedule Regular Re-scanning: Use a tool like Starboard Operator, which runs as a Kubernetes operator and periodically re-scans running workloads for new vulnerabilities, creating security reports as CRDs in the cluster.
- Establish a Secure Development Foundation: The integrity of your supply chain starts with your development processes. A robust Secure System Development Life Cycle (SDLC) is foundational for ensuring your code and its dependencies are secure long before they are packaged into a container.
9. Use Custom Metrics and Application-Level Observability
Monitoring infrastructure health is crucial, but it only tells part of the story. A perfectly healthy Kubernetes cluster can still run buggy, underperforming applications. True visibility requires extending monitoring into the application layer itself, instrumenting code to expose custom metrics that reflect business logic, user experience, and internal service behavior. This approach provides a complete picture of system performance, connecting infrastructure state directly to business outcomes.
This practice is essential for moving from reactive to proactive operations. For example, an e-commerce platform can track checkout completion rates and item processing times, correlating a drop in conversions with a specific microservice's increased latency. Similarly, a SaaS company can instrument metrics for new feature adoption, immediately detecting user-facing issues after a deployment that infrastructure metrics would completely miss. These application-level signals are the most direct indicators of user-impacting problems.
Actionable Implementation Tips
To effectively implement application-level observability, integrate these practices into your development and operations workflows:
- Standardize on OpenTelemetry: Adopt the OpenTelemetry SDKs. Here is an example of creating a custom counter metric in a Go application to track processed orders:
import ( "go.opentelemetry.io/otel" "go.opentelemetry.io/otel/metric" ) var meter = otel.Meter("my-app/orders") func main() { orderCounter, _ := meter.Int64Counter("orders_processed_total", metric.WithDescription("The total number of processed orders."), ) // ... later in your code when an order is processed orderCounter.Add(ctx, 1, attribute.String("status", "success")) } - Manage Metric Cardinality: When creating custom metrics, avoid using high-cardinality labels. For example, use
payment_method(card, bank, crypto) as a label, but do not usecustomer_idas a label, as this would create a unique time series for every customer. Reserve high-cardinality data for logs or trace attributes. - Create Instrumentation Libraries: Develop a shared internal library that wraps the OpenTelemetry SDK. This library can provide pre-configured middleware for your web framework (e.g., Gin, Express) that automatically captures RED (Rate, Errors, Duration) metrics for all HTTP endpoints, ensuring consistency.
- Implement Strategic Sampling: For high-volume applications, use tail-based sampling with the OpenTelemetry Collector. The
tailsamplingprocessorcan be configured to make sampling decisions after all spans for a trace have been collected, allowing you to keep all error traces or traces that exceed a certain latency threshold while sampling healthy traffic.processors: tail_sampling: policies: - name: errors-policy type: status_code status_code: status_codes: [ERROR] - name: slow-traces-policy type: latency latency: threshold_ms: 500
10. Implement Node and Cluster Health Monitoring
While application-level monitoring is critical, the underlying Kubernetes platform must be stable for those applications to run reliably. This requires a dedicated focus on the health of individual nodes and the core cluster components that orchestrate everything. This layer of monitoring acts as the foundation of your observability strategy, ensuring that issues with the scheduler, etcd, or worker nodes are detected before they cause cascading application failures.
Monitoring this infrastructure layer involves tracking key signals like node conditions (e.g., MemoryPressure, DiskPressure, PIDPressure), control plane component availability, and CNI plugin health. For instance, an engineering team might detect rising etcd leader election latency, a precursor to cluster instability, and take corrective action. Similarly, automated alerts for a node entering a NotReady state can trigger remediation playbooks, like cordoning and draining the node, long before user-facing services are impacted.
Actionable Implementation Tips
To build a robust cluster health monitoring practice, focus on these critical areas:
- Monitor All Control Plane Components: Use
kube-prometheus-stack, which provides out-of-the-box dashboards and alerts for the control plane. Key PromQL queries to monitor include:- Etcd:
histogram_quantile(0.99, etcd_disk_wal_fsync_duration_seconds_bucket)(should be <10ms). - API Server:
apiserver_request_latencies_bucketto track API request latency. - Scheduler:
scheduler_scheduling_latency_secondsto monitor pod scheduling latency.
- Etcd:
- Deploy Node Exporter for OS Metrics: The
kubeletprovides some node metrics, but for deep OS-level insights, deploy the Prometheusnode-exporteras a DaemonSet. This exposes hundreds of Linux host metrics. An essential alert is for disk pressure:# alert: NodeDiskPressure expr: kube_node_status_condition{condition="DiskPressure", status="true"} == 1 for: 10m - Track Persistent Volume Claim (PVC) Usage: Monitor PVC capacity to prevent applications from failing due to full disks. This PromQL query identifies PVCs that are over 85% full:
# alert: PVCRunningFull expr: (kubelet_volume_stats_used_bytes / kubelet_volume_stats_capacity_bytes) > 0.85 - Monitor CNI Plugin Connectivity: Network partitions can silently cripple a cluster. Deploy a tool like
kubernetes-network-healthor use a CNI that exposes health metrics. For Calico, you can monitorcalico_felix_active_local_endpointsto ensure the agent on each node is healthy. A drop in this number can indicate a CNI issue on a specific node.
Kubernetes Monitoring Best Practices — 10-Point Comparison
| Practice | Implementation complexity | Resource requirements | Expected outcomes | Ideal use cases | Key advantages |
|---|---|---|---|---|---|
| Implement Comprehensive Metrics Collection with Prometheus | Medium — scrape/config, federation for scale | Low–Medium (small); High if long-term retention without remote store | Time-series metrics, alerting, proactive cluster/app visibility | Kubernetes cluster and app-level monitoring at scale | Purpose-built for K8s, PromQL, large exporter ecosystem |
| Centralize Logs with a Production-Grade Log Aggregation Stack | High — pipeline, indices, tuning | High — storage and compute at scale | Searchable logs, fast troubleshooting, audit trails | Large microservices fleets, compliance and security investigations | Full-text search, structured logs, forensic and compliance support |
| Establish Distributed Tracing for End-to-End Visibility | High — instrumentation + tracing backend setup | Medium–High — trace storage and ingestion costs | Request flow visibility, latency hotspots, dependency graphs | Complex microservice architectures and payment/transaction systems | Correlates requests across services; reveals hidden latency |
| Monitor Container Resource Utilization and Implement Requests/Limits | Medium — profiling, tuning, autoscaler integration | Low–Medium — metrics-server, autoscaler resources | Prevent OOMs/throttling, right-size resources, cost savings | Cost-conscious clusters, bursty or variable workloads | Improves reliability and optimizes cluster utilization |
| Design Alerting Strategies with Alert Fatigue Prevention | Medium — rule design, routing, runbooks | Low–Medium — alerting platform and integrations | Actionable alerts, reduced noise, faster remediation | On-call teams, production incidents, SRE practices | Reduces fatigue, focuses on user-impacting issues |
| Implement Network Policy Monitoring and Security Observability | High — flow capture, correlation, eBPF tooling | High — flow logs and analysis storage/compute | Detect lateral movement, policy violations, exfiltration | Regulated environments, high-security clusters | Validates policies, detects network-based attacks, aids compliance |
| Establish SLOs/SLIs and Monitor Them as First-Class Metrics | Medium — define SLOs, integrate metrics and alerts | Low–Medium — metric collection and dashboards | Business-aligned reliability, error budgets, informed releases | Customer-facing services, teams using release gating | Aligns engineering with business goals; guides release decisions |
| Monitor and Secure Container Image Supply Chain | Medium–High — CI/CD integration, admission policies | Low–Medium — scanning compute; ongoing updates | Prevent vulnerable images, enforce provenance and policies | Organizations requiring strong supply-chain security/compliance | Blocks vulnerable deployments, enables attestation and SBOMs |
| Use Custom Metrics and Application-Level Observability | High — developer instrumentation and standards | Medium–High — high-cardinality metric costs | Business and feature-level insights, performance profiling | Product teams tracking user journeys and business KPIs | Reveals app behavior invisible to infra metrics; supports A/B and feature validation |
| Implement Node and Cluster Health Monitoring | Medium — control plane and node metric collection | Low–Medium — exporters and control-plane metrics | Early detection of platform degradation, capacity planning | Platform teams, self-hosted clusters, critical infra | Prevents cascading failures and supports proactive maintenance |
From Data Overload to Actionable Intelligence
Navigating the complexities of Kubernetes observability is not merely about collecting data; it's about transforming a deluge of metrics, logs, and traces into a coherent, actionable narrative that drives operational excellence. Throughout this guide, we've dissected the critical pillars of a robust monitoring strategy, moving beyond surface-level health checks to a deep, multi-faceted understanding of your distributed systems. The journey from a reactive, chaotic environment to a proactive, resilient one is paved with the deliberate implementation of these Kubernetes monitoring best practices.
Adopting these practices means shifting your organizational mindset. It's about treating observability as a first-class citizen in your development lifecycle, not as an afterthought. By implementing comprehensive metrics with Prometheus, centralizing logs with a scalable stack like the ELK or Loki, and weaving in distributed tracing, you build the foundational "three pillars." This trifecta provides the raw data necessary to answer not just "what" went wrong, but "why" it went wrong and "how" its impact cascaded through your microservices.
Synthesizing the Core Principles for Success
The true power of these best practices emerges when they are integrated into a cohesive strategy. Isolated efforts will yield isolated results. The key is to see the interconnectedness of these concepts:
- Resource Management as a Performance Lever: Monitoring container resource utilization isn't just about preventing OOMKilled errors. It's directly tied to your SLOs and SLIs, as resource contention is a primary driver of latency and error rate degradation. Proper requests and limits are the bedrock of predictable performance.
- Security as an Observability Domain: Monitoring isn't limited to performance. By actively monitoring network policies, container image vulnerabilities, and API server access, you transform your observability platform into a powerful security information and event management (SIEM) tool. This proactive stance is essential for maintaining a secure posture in a dynamic containerized world.
- Alerting as a Precision Instrument: A high-signal, low-noise alerting strategy is the ultimate goal. This is achieved by anchoring alerts to user-facing SLIs and business-critical outcomes, rather than arbitrary infrastructure thresholds. Your alerting rules should be the refined output of your entire monitoring system, signaling genuine threats to service reliability, not just background noise.
- Application-Level Insight is Non-Negotiable: Infrastructure metrics tell you about the health of your nodes and pods, but custom application metrics tell you about the health of your business. Instrumenting your code to expose key performance indicators (e.g., items in a processing queue, user sign-ups per minute) connects cluster operations directly to business value.
Your Path Forward: From Theory to Implementation
Mastering these Kubernetes monitoring best practices is an iterative journey, not a one-time project. Your next steps should focus on creating a feedback loop for continuous improvement. Start by establishing a baseline: define your most critical SLIs and build dashboards to track them. From there, begin layering in the other practices. Instrument one critical service with distributed tracing to understand its dependencies. Harden your alerting rules for that service to reduce fatigue. Analyze its resource consumption patterns to optimize its cost and performance.
Ultimately, a mature observability practice empowers your teams with the confidence to innovate, deploy faster, and resolve incidents with unprecedented speed and precision. It moves you from guessing to knowing, transforming your Kubernetes clusters from opaque, complex beasts into transparent, manageable, and highly-performant platforms for your applications. This strategic investment is the dividing line between merely running Kubernetes and truly mastering it.
Implementing a production-grade observability stack from the ground up requires deep, specialized expertise. OpsMoon connects you with a global network of elite, vetted freelance DevOps and SRE engineers who have mastered these Kubernetes monitoring best practices in real-world scenarios. Build a resilient, scalable, and cost-effective monitoring platform with the exact talent you need, when you need it, by visiting OpsMoon to get started.