8 Essential Log Management Best practices for DevOps in 2025
 By opsmoon
Discover 8 technical log management best practices for DevOps. Learn to centralize, structure, and secure logs for ultimate observability and faster MTTR.
In modern DevOps and SRE cultures, logs are more than just diagnostic text files; they are the definitive, immutable record of your system's behavior, from application performance to security events. However, without a strategic approach, they quickly become an overwhelming, expensive, and ultimately useless data swamp. The sheer volume generated by microservices, containers, and serverless functions can easily outpace a team's ability to analyze it, turning a potential asset into a significant liability.
Effective log management isn't just about collecting data. It's about implementing a disciplined engineering practice to transform raw, unstructured output into actionable intelligence that drives system reliability, strengthens security posture, and optimizes performance. Poorly managed logs lead to extended incident response times (MTTR), missed security threats, and an inability to understand complex system interactions. Conversely, a robust logging strategy is a cornerstone of a mature observability platform.
This guide cuts through the generic advice to provide a curated list of eight technical, battle-tested log management best practices. We will move beyond high-level concepts and dive into the specific architectural patterns, tooling configurations, and process disciplines required to build a scalable and efficient logging pipeline. For engineers and technical leaders, these practices are not optional; they are foundational for moving from reactive firefighting to proactive, data-driven operations. This article will show you how to structure, centralize, and analyze logs to not only solve problems faster but also to prevent them from happening in the first place.
1. Centralized Log Aggregation
Centralized log aggregation is the foundational practice of collecting logs from all systems, applications, and infrastructure components into a single, unified repository. In a modern, distributed architecture, log data is scattered across servers, containers, cloud services, and microservices. This practice eliminates the need to manually ssh into individual machines to review logs, providing a holistic, queryable view of your entire technology stack.
This approach is critical for effective log management because it enables powerful cross-system analysis. For instance, you can correlate an application error on one microservice with a database performance spike and an unusual API gateway latency all within a single interface. Companies like Netflix and Uber leverage this at a massive scale to monitor complex microservices architectures, processing billions of events daily to maintain service reliability and diagnose issues quickly.
Why It's a Core Practice
Centralizing logs is non-negotiable for any team serious about observability and operational efficiency. It directly supports faster troubleshooting, proactive security monitoring, and comprehensive performance analysis. Without a central hub, identifying the root cause of a distributed system failure becomes a time-consuming and often fruitless exercise.
For those operating within the AWS ecosystem, understanding the distinctions and complementary functions of services like AWS CloudWatch and CloudTrail is crucial for effective log management, as detailed in this AWS CloudWatch vs. CloudTrail guide. These services generate vital data that should be fed into your centralized system.
Actionable Implementation Tips
To effectively implement centralized log aggregation, follow these technical best practices:
- Deploy a Robust Log Shipper: Standardize on a lightweight, efficient log shipper like Fluent Bit, Vector, or Filebeat. Configure it as a sidecar container in Kubernetes or a daemonset to automatically collect logs from all nodes and pods.
- Tag Logs with Rich Metadata: Use log shippers to enrich logs at the source. Include tags for the environment (
prod,staging), application name (-n my-app), Kubernetes namespace (--namespace my-ns), service version (v1.2.3), region (us-east-1), and host instance ID for precise filtering. - Implement Edge Buffering: Configure your log shippers to buffer logs locally before transmission (e.g., using
mem_buf_limitin Fluent Bit). This prevents data loss during network interruptions or when the central logging system is temporarily unavailable. - Use Compression: Enable compression (e.g., Gzip, Zstd) on your log shippers to significantly reduce network bandwidth usage and storage costs. For example, in Filebeat, you can set
output.elasticsearch.compression_level: 5. - Establish a Multi-Layered Architecture: For large-scale deployments, use a tiered architecture. Deploy lightweight shippers on edge nodes, which forward logs to a fleet of intermediate aggregators (e.g., running Logstash or a heavier Fluentd instance) for more complex parsing and enrichment before sending them to the final storage backend like Elasticsearch.
2. Structured Logging with Consistent Formats
Structured logging is the practice of generating logs in a consistent, machine-readable format like JSON rather than as unstructured text strings. This approach transforms logs from simple text into rich data events with defined fields and values. This structure makes them instantly parsable, searchable, and analyzable by modern logging platforms without requiring complex and brittle regular expressions.

By treating logs as data, you enable powerful, high-performance querying and analytics. For example, Stripe implements JSON-structured logs with precise field definitions to track payment transactions for compliance and monitoring. Similarly, Google uses structured logging with standardized fields across all internal services, a practice popularized by its Site Reliability Engineering (SRE) discipline to enable distributed tracing and automated analysis at a planetary scale.
Why It's a Core Practice
Adopting structured logging is one of the most impactful log management best practices for any modern application. It drastically reduces the "time-to-insight" by making logs easy to filter, aggregate, and visualize. When an incident occurs, your team can immediately query for status_code=500 or user_id=12345 instead of trying to craft a grep command to parse a free-form string, dramatically accelerating root cause analysis.
This practice is a key tenet of methodologies like the Twelve-Factor App and is fundamental to building observable, cloud-native systems. It moves your logs from being a passive record of events to an active, queryable dataset that fuels dashboards, alerts, and automated incident response.
Actionable Implementation Tips
To effectively implement structured logging, focus on consistency and contextual richness:
- Adopt JSON as the Standard: Standardize on JSON as your default log format. Its widespread support across virtually all logging libraries, shippers, and platforms ensures maximum compatibility and interoperability.
- Define a Company-Wide Schema: Establish a baseline logging schema with mandatory fields for every log event. An example schema could be:
{"timestamp": "...", "level": "INFO", "service.name": "...", "service.version": "...", "trace.id": "...", "message": "...", "http.status_code": 200}. - Use Native Structured Logging Libraries: Leverage libraries that support structured logging out-of-the-box, like Zap in Go, Serilog in .NET, or Winston in Node.js. These libraries handle JSON serialization and context management automatically.
- Include Correlation IDs: Ensure every log related to a single request or transaction contains a unique correlation ID (e.g.,
trace_idorrequest_id). This allows you to easily reconstruct the entire journey of a request across multiple microservices. - Version Your Log Schemas: As your applications evolve, your log schemas will too. Treat your schema like an API and version it (e.g.,
schema_version: "1.1"). This prevents breaking changes in your downstream parsing and alerting rules.
3. Implement Proper Log Levels and Severity Classification
Implementing proper log levels is the practice of categorizing log messages by severity (e.g., DEBUG, INFO, WARN, ERROR) to control log verbosity and enable efficient filtering. This allows developers to generate detailed diagnostic information during development while maintaining clean, actionable logs in production. By assigning a level to each log message, teams can dynamically adjust the amount of data being captured, significantly reducing noise and focusing attention on what matters most.
This classification system, popularized by frameworks like Log4j and the Syslog protocol, is a cornerstone of effective log management best practices. For example, Spotify strategically adjusts log levels per deployment environment: DEBUG in development for granular tracing, INFO in staging to observe key application flows, and a more conservative WARN in production to minimize volume while still capturing potential issues. This tiered approach prevents production systems from being overwhelmed by non-critical data.
Why It's a Core Practice
Without a clear severity hierarchy, logs become a monolithic, undifferentiated stream of text, making it nearly impossible to distinguish a critical system failure from a routine operational message. Proper log levels empower SREs and developers to quickly isolate errors, suppress insignificant data, and dynamically increase verbosity for specific services during an incident without requiring a redeployment. This capability is crucial for rapid troubleshooting and maintaining system stability under pressure.
Adopting this practice also leads to significant cost savings in terms of log ingestion, storage, and processing. By setting a sensible default level like INFO or WARN in production, you dramatically cut down on the data volume generated by verbose DEBUG logs, which often constitute the majority of log output.
Actionable Implementation Tips
To effectively implement log levels and severity classification, follow these technical best practices:
- Establish a Clear Hierarchy: Standardize log levels across your organization based on a model like Syslog's severity levels. A common, effective hierarchy is:
- DEBUG: Verbose diagnostic information for developers (e.g., variable values, function entry/exit).
- INFO: Significant application lifecycle events (e.g., "Service started," "User logged in").
- WARN: Recoverable issues or potentially harmful situations (e.g., "API rate limit approaching," "Deprecated endpoint used").
- ERROR: Application failures or unexpected conditions that require investigation (e.g., "Failed to connect to database," "Null pointer exception").
- FATAL/CRITICAL: Severe errors that cause the application to terminate (e.g., "Unrecoverable database corruption detected").
- Set Production Defaults Wisely: Configure your production environments to log at the
INFOorWARNlevel by default. This provides a balance between visibility and cost, filtering out excessiveDEBUGnoise. - Enable Dynamic Level Adjustment: Implement a mechanism, such as an exposed admin endpoint (
/loglevel), a configuration management tool (e.g., Consul, Etcd), or feature flags, that allows operators to change the log level of a running service on the fly without a restart. - Create Organizational Guidelines: Document clear, concise guidelines with code examples for when to use each log level. For example,
WARNshould be used for events that are actionable but not yet errors. - Audit Log Level Usage: Periodically review application logs to ensure levels are being used correctly. Mismatched severities, such as logging a critical error as
INFO, can hide serious problems. Use linters or static analysis tools to check for anti-patterns.
4. Establish Comprehensive Log Retention and Archival Policies
Establishing a comprehensive log retention and archival policy is the practice of defining how long different types of logs are stored and where they are kept. This involves classifying logs and moving them through different storage tiers-from expensive, high-performance "hot" storage for active analysis to cheaper, slower "cold" storage for long-term compliance. This structured approach ensures you meet regulatory obligations while optimizing storage costs.
This practice is non-negotiable for organizations governed by regulations like GDPR, HIPAA, or SOX. For instance, a financial institution like JP Morgan Chase must retain specific transaction logs for over seven years to comply with financial regulations. Similarly, healthcare providers must retain audit logs for at least six years under HIPAA. A well-defined policy automates the data lifecycle, preventing uncontrolled storage growth and ensuring data is available when needed for audits or historical analysis.
The following diagram illustrates a common tiered storage hierarchy for a log retention policy.
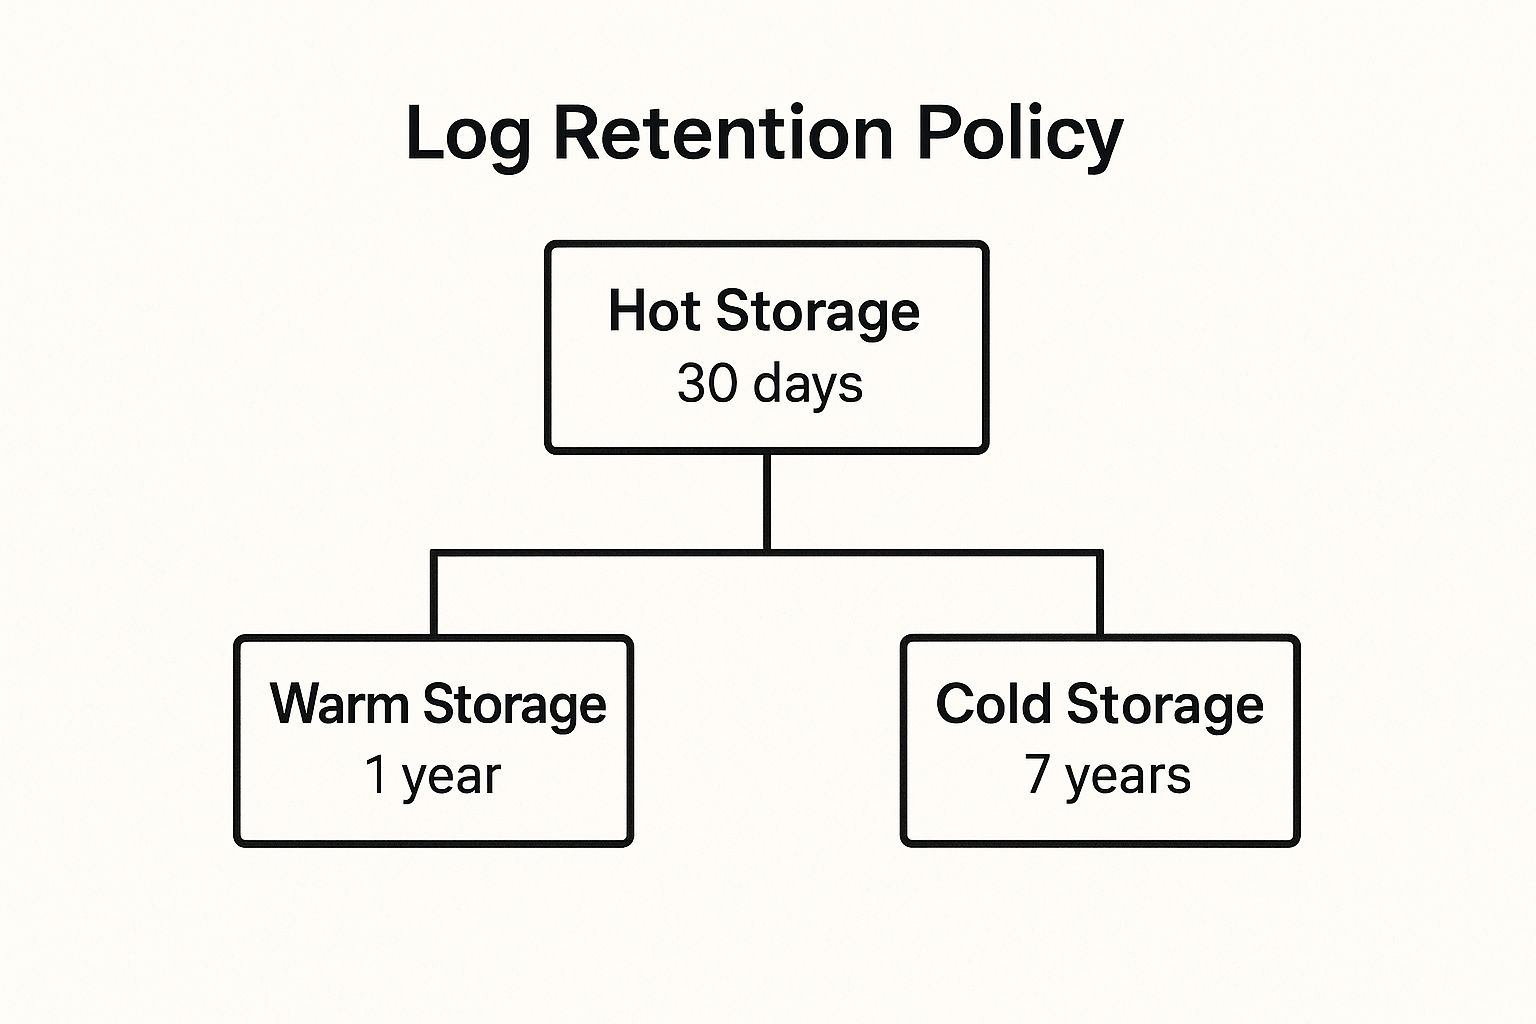
This hierarchical model effectively balances immediate data accessibility for troubleshooting with cost-effective, long-term archival for compliance.
Why It's a Core Practice
Without a formal retention policy, organizations face two major risks: spiraling storage costs and non-compliance with legal or regulatory standards. Storing all logs in high-performance, searchable storage indefinitely is financially unsustainable. Conversely, prematurely deleting logs can lead to severe penalties and an inability to investigate security incidents or system failures. A structured policy provides a defensible, cost-optimized framework for managing log data throughout its lifecycle.
Actionable Implementation Tips
To implement effective log retention and archival, adopt these technical best practices:
- Define Tiers Based on Log Type: Classify your logs and set distinct retention periods. For example, keep verbose debug logs for 7-14 days in hot storage, while critical security and audit logs may need to be archived for 7+ years in cold storage.
- Keep 7-30 Days in Hot Storage: Use fast, indexed storage like Elasticsearch for logs requiring immediate analysis and troubleshooting. This tier should hold only the most recent and relevant data.
- Use Cold Storage for Compliance: Leverage cost-effective archival solutions like AWS S3 Glacier Deep Archive or Google Cloud Archive Storage for multi-year retention mandated by compliance frameworks. Access is slow, but storage costs are minimal.
- Implement Automated Lifecycle Management: Use features within your logging platform (e.g., Elasticsearch Index Lifecycle Management – ILM) or cloud provider (e.g., AWS S3 Lifecycle policies) to automatically transition logs between hot, warm, and cold tiers and eventually delete them. Never rely on manual processes.
- Test Restoration Procedures Regularly: Periodically test your ability to retrieve and rehydrate logs from warm and cold archives. An archive is useless if you cannot restore data from it in a timely manner during an actual incident. Document and automate the restoration process.
5. Enable Real-Time Log Monitoring and Alerting
Real-time log monitoring and alerting involves continuously analyzing log streams as they are generated to immediately detect anomalies, errors, security threats, or performance degradation. This proactive approach uses pattern matching, threshold-based triggers, and correlation rules to automatically notify teams when specific conditions occur. Instead of waiting for users to report problems, this practice enables engineers to identify and respond to issues before they escalate, drastically reducing mean time to detection (MTTD) and mean time to resolution (MTTR).

This shift from reactive to proactive incident management is a cornerstone of modern SRE and DevOps cultures. For example, PayPal uses real-time log analysis to detect fraudulent transaction patterns and triggers immediate investigation workflows. Similarly, Slack monitors message delivery logs and alerts operations teams within seconds when delivery failure rates exceed normal thresholds, allowing for swift intervention. This practice is essential for maintaining service level objectives (SLOs) and ensuring customer trust.
Why It's a Core Practice
Without real-time alerting, log data is a historical archive used for post-mortem analysis. Activating automated monitoring transforms your logs into a live, active defense mechanism for system reliability and security. This is a non-negotiable step for any organization that prioritizes uptime and performance, as it directly connects observability data to actionable incident response.
Effective alerting is a key component of a broader strategy, which you can explore in this guide on what is continuous monitoring. This approach ensures that your observability platform is not just collecting data but is actively working to protect your systems.
Actionable Implementation Tips
To build a robust and effective real-time alerting system, implement these technical best practices:
- Start with Critical Alerts Only: Begin by configuring alerts for high-impact events:
level:ERROR,http.status_code:[500 TO 599], or security events likeevent.action:"user-login-failure". This helps prevent alert fatigue. - Implement Alert Deduplication: Group related alerts from a single incident into one notification. Use features like
correlation_idor alert grouping in tools like Alertmanager to consolidate a storm of5xxerrors from one service into a single page. - Use Escalation Tiers: Define a clear escalation path. Notify the on-call engineer first (e.g., via PagerDuty), then a secondary engineer if unacknowledged after 15 minutes, and finally, the team lead or manager.
- Create Alert-Specific Runbooks: Link every alert to a runbook detailing the probable cause, diagnostic steps (e.g., specific log queries, Grafana dashboards), and remediation procedures (e.g., "how to restart the pod," "how to fail over the database").
- Choose Channels Based on Severity: Route alerts to different channels based on urgency. Use a platform like PagerDuty or Opsgenie for critical incidents requiring immediate action and Slack or Microsoft Teams for warnings and non-urgent notifications.
- Suppress Alerts During Maintenance: Implement a system to temporarily silence alerts for systems undergoing planned maintenance to avoid false positives and unnecessary noise. Tools like Alertmanager have built-in silencing capabilities.
- Include Rich Context in Alerts: Ensure every alert message includes key metadata:
service,environment,timestamp, a summary (High 5xx error rate), and a direct link to the relevant logs or dashboard.
6. Implement Log Security and Access Control
Log security and access control is the practice of safeguarding log data against unauthorized access, modification, and deletion. Because logs often contain sensitive information like authentication details, system vulnerabilities, or personally identifiable information (PII), they are a primary target for attackers and a significant compliance risk. This practice involves a multi-layered defense, including encryption for logs in transit and at rest, strict role-based access control (RBAC), and data masking techniques.
This discipline is non-negotiable for maintaining security posture and regulatory compliance. For example, a financial institution like Capital One uses strict RBAC to ensure only authorized compliance officers can access transaction logs, preventing misuse by internal staff. Similarly, healthcare providers must mask patient data in application logs to comply with HIPAA, while still allowing developers to debug system performance. These measures protect sensitive data without sacrificing the operational value of logs.
Why It's a Core Practice
Unsecured logs are a critical vulnerability. A single data breach originating from exposed log files can lead to severe financial penalties, reputational damage, and loss of customer trust. Implementing robust security and access controls transforms logs from a potential liability into a secure, reliable asset for incident response, compliance audits, and system forensics. This is a foundational element of a mature DevOps security strategy.
As organizations integrate security deeper into their development lifecycle, these logging practices become essential. For a broader perspective on securing your entire pipeline, exploring comprehensive DevOps security best practices can provide valuable context for how secure logging fits into the bigger picture.
Actionable Implementation Tips
To effectively implement log security and access control, follow these technical best practices:
- Never Log Credentials in Plain Text: Enforce a strict policy against logging passwords, API keys, credit card numbers, or authentication tokens. Use static analysis security testing (SAST) tools or pre-commit hooks (e.g.,
ggshield,trufflehog) to scan for these patterns before code is merged. - Encrypt Data in Transit and at Rest: Use TLS 1.2+ for all log transmission between services, shippers, and your central aggregator. Encrypt log files at rest on disk using strong algorithms like AES-256 with provider-managed keys (e.g., AWS KMS, Google Cloud KMS).
- Implement Granular Role-Based Access Control (RBAC): Configure your logging platform to grant permissions based on roles. For example,
dev-team-alphacan view logs whereservice.name=alpha-servicein thedevenvironment, while thesecurity-teamcan view all logs wherelog.type=audit. - Automate PII Detection and Masking: Use your log processing pipeline (e.g., with Logstash or Fluentd filters) to automatically detect and mask sensitive data like Social Security Numbers, email addresses, or phone numbers using regex patterns. For example, a Logstash
mutatefilter can replace a field with a hash or a static string. - Create Immutable Audit Trails: Log all access to log data itself. Record who accessed which logs, from what IP address, and at what time. Store these audit logs in a tamper-proof or write-once, read-many (WORM) storage system like AWS S3 with Object Lock.
7. Context-Rich Logging with Correlation IDs
Context-rich logging with correlation IDs is the practice of enriching log entries with unique identifiers that trace requests or user sessions across distributed systems. In a microservices architecture, a single user action can trigger a cascade of calls across dozens of services. A correlation ID, also known as a trace ID, is generated at the entry point of a request and propagated through every component that handles it.
This technique transforms disconnected log lines from various services into a coherent narrative of a single transaction. It allows engineers to reconstruct the complete journey of a request, dramatically simplifying debugging and performance analysis. For example, Uber generates a unique ID for each ride request, tracking it through pricing, matching, routing, and payment services to analyze the entire trip lifecycle. Similarly, Amazon uses X-Amzn-Trace-Id to trace requests across services like API Gateway, Lambda, and DynamoDB.
Why It's a Core Practice
In distributed environments, identifying the root cause of an issue without correlation IDs is like finding a needle in a haystack of disconnected logs. This practice is essential for effective log management because it provides a direct, traceable link between events. It enables you to instantly filter logs from multiple services that all pertain to a single failed transaction, reducing Mean Time to Resolution (MTTR) from hours to minutes.
The concept was popularized by systems like Google's Dapper and is a core principle of modern observability platforms like Jaeger and Zipkin, as well as the OpenTelemetry standard. Understanding how to implement this is a non-negotiable skill for any team managing microservices.
Actionable Implementation Tips
To effectively implement logging with correlation IDs, follow these technical best practices:
- Generate IDs at the Edge: Configure your edge components (API gateway, load balancer) to generate a unique ID (e.g., a UUID) for every incoming request and add it to a standard header like
X-Request-ID. - Propagate IDs via HTTP Headers: Use a standardized header, such as the W3C Trace Context headers (
traceparent,tracestate), to propagate the ID between services. Most modern frameworks and service meshes (like Istio) can handle this automatically. - Automate with Middleware: Implement middleware or interceptors in your application frameworks (e.g., Express.js middleware, ASP.NET Core middleware) to automatically extract the ID from incoming request headers and attach it to the logging context for all subsequent log statements.
- Use Logging Context: Leverage your logging library's context features (like Mapped Diagnostic Context (MDC) in Log4j/Logback or
ContextVarin Python) to ensure the correlation ID is automatically included in every log line without manual intervention from the developer. - Trace Database Queries: Include the correlation ID in SQL comments (e.g.,
/* trace.id=abc-123 */ SELECT ...). This helps you connect slow database queries directly back to the specific application request that triggered them. Many ORMs and database drivers can be configured to do this automatically.
8. Automated Log Analysis and Anomaly Detection
Automated log analysis leverages machine learning (ML) and statistical models to automatically identify unusual patterns, errors, and security threats within vast streams of log data. Instead of relying on manual review or predefined rules, this practice establishes a baseline of normal system behavior and flags significant deviations. This approach uses techniques like clustering, time-series analysis, and behavioral modeling to surface subtle issues that would be impossible for a human to find.
This level of automation is a game-changer for modern DevOps and SRE teams. For example, Shopify employs automated analysis to detect sophisticated bot traffic by identifying anomalous request patterns before traditional rate-limiting can react. Similarly, Microsoft Azure uses ML-based log analysis to predict resource exhaustion, allowing it to recommend scaling actions before performance degrades. These applications of automated log management best practices shift teams from a reactive to a proactive operational posture.
Why It's a Core Practice
In high-volume, dynamic environments, manual log analysis is not scalable. Automated anomaly detection is crucial for identifying zero-day attacks, emerging performance bottlenecks, and complex, multi-system failures that don't trigger simple alerts. It reduces alert fatigue by surfacing only the most statistically significant events, allowing engineers to focus their attention where it's needed most. To further enhance detection beyond automated anomaly identification, organizations can employ proactive threat hunting strategies that leverage rich log data.
Actionable Implementation Tips
To effectively implement automated log analysis and anomaly detection, consider these technical strategies:
- Start with Log Clustering: Implement log clustering (e.g., using Drain or LogReduce algorithms) to group similar log messages into templates. This reduces millions of log lines to a few dozen patterns, making it easier to spot new or rare error types.
- Combine with Rule-Based Alerts: Don't abandon traditional alerts. Use ML-based detection to find the "unknown unknowns" (e.g., a sudden spike in a rare log message) while relying on rule-based alerts for the "known knowns" (e.g.,
status_code:500), creating a comprehensive monitoring strategy. - Establish a Feedback Loop: Implement a mechanism for engineers to label anomalies as true or false positives (e.g., a thumbs up/down button in the alert). This feedback is essential for retraining and improving the accuracy of your ML models over time.
- Use Multiple Algorithms: No single algorithm is perfect. Leverage a combination of techniques like isolation forests for outlier detection, autoencoders for reconstruction error analysis, and clustering (e.g., DBSCAN) to detect different types of anomalies, as offered by tools like Elastic Machine Learning and Datadog Watchdog.
- Implement Explainability (XAI): Choose tools that provide context on why an event was flagged as an anomaly (e.g., "This log pattern is rare for a Tuesday morning"). This is critical for helping engineers trust the system and diagnose the underlying issue faster. This principle is explored further in various automated testing strategies, where understanding test failures is as important as the tests themselves.
Best Practices Comparison Matrix
| Item | Implementation Complexity | Resource Requirements | Expected Outcomes | Ideal Use Cases | Key Advantages |
|---|---|---|---|---|---|
| Centralized Log Aggregation | High setup complexity, needs scaling and configuration | Significant storage and network bandwidth | Unified log access, faster troubleshooting, holistic overview | Large-scale distributed systems, security monitoring, compliance | Eliminates silos, supports advanced analytics, cross-team visibility |
| Structured Logging with Consistent Formats | Moderate, needs schema design and developer discipline | Moderate, larger log sizes due to structured data | Improved searchability, efficient automated analysis | Systems needing precise and automated log processing | Consistent, machine-readable logs, better analytics and alerting |
| Implement Proper Log Levels | Low to moderate, requires team training | Low, minimal additional resources | Controlled log verbosity, faster issue identification | Multi-environment deployments, development vs. production | Reduces noise, dynamic verbosity control, severity-based alerts |
| Establish Comprehensive Log Retention | Moderate to high, needs policy and automation design | Variable; optimized by tiered storage | Cost-effective storage, legal compliance, data lifecycle management | Regulated industries, large data volume environments | Storage cost reduction, compliance adherence, archival automation |
| Enable Real-Time Log Monitoring and Alerting | High, involves complex rule and system setup | High compute and maintenance resources | Immediate issue detection, reduced MTTD/MTTR | Critical systems requiring proactive monitoring | Proactive alerts, reduces outages, supports compliance |
| Implement Log Security and Access Control | High, requires security architecture and ongoing management | Moderate to high for encryption and audits | Protected logs, compliance with data security standards | Sensitive data environments, regulated sectors | Data breach prevention, audit trails, role-based access |
| Context-Rich Logging with Correlation IDs | Moderate, needs cross-team coordination and instrumentation | Moderate, increased log size and processing | End-to-end tracing, simplified distributed debugging | Microservices, distributed systems | Precise request tracking, root cause analysis, improved collaboration |
| Automated Log Analysis and Anomaly Detection | High, requires ML models, training data, and tuning | High computational resources | Detects unknown issues, reduces manual review effort | Large-scale environments needing proactive anomaly detection | Identifies subtle patterns, reduces false positives, scales well |
From Implementation to Mastery: Your Next Steps in Log Management
Navigating the complex landscape of modern IT systems without a robust logging strategy is like trying to sail a ship in a storm without a compass. The eight log management best practices we've explored serve as that compass, guiding you from reactive firefighting to a state of proactive, strategic observability. This journey transforms your logs from a simple audit trail into a rich, queryable database of system behavior, security events, and performance metrics.
The transition begins with foundational principles. Centralizing your logs into a single, unified platform (Best Practice #1) and enforcing structured formats like JSON (Best Practice #2) are the non-negotiable first steps. These practices eliminate data silos and create a consistent, machine-readable dataset, paving the way for every advanced technique that follows. Without this solid ground, efforts to monitor, alert, or analyze will be built on sand.
From Foundational to Advanced: The Path to Maturity
Once you have a handle on aggregation and structure, the focus shifts to refinement and intelligence. Implementing clear log levels (Best Practice #3) and defining comprehensive retention policies (Best Practice #4) brings order and efficiency to your data lifecycle management. This ensures that you store what's necessary, archive what's valuable for the long term, and discard what's merely noise, optimizing both cost and performance.
The true power of a mature logging practice is unlocked when you move from passive collection to active analysis. Real-time monitoring and alerting (Best Practice #5) turn your log management system into a dynamic defense mechanism, notifying you of issues the moment they arise. Layering on robust security and access controls (Best Practice #6) is critical, protecting this sensitive data from unauthorized access and ensuring compliance with regulations like GDPR and HIPAA.
Finally, mastery is achieved by enriching your logs with deep context and automating their analysis. Integrating correlation IDs (Best Practice #7) allows you to trace a single user request across a dozen microservices, providing a holistic view that is essential for debugging distributed systems. Topping this off with automated anomaly detection (Best practice #8) leverages machine learning to identify subtle patterns and deviations that a human operator would almost certainly miss, predicting potential failures before they impact your users.
Actionable Roadmap for Your Team
Embarking on this journey doesn't require a complete, overnight overhaul. The most successful implementations follow an iterative, pragmatic approach. Start by identifying your most critical application or service and apply these principles there.
- Start with the Basics: Focus first on centralizing logs and enforcing a structured format for a single, high-value service.
- Iterate and Expand: Once you see the benefits, roll out the same foundational practices to other services, refining your approach based on lessons learned.
- Layer in Advanced Capabilities: With a solid foundation, begin implementing real-time alerting and context-rich logging to reduce your Mean Time to Resolution (MTTR).
- Automate for Scale: As your system complexity grows, invest in automated analysis and anomaly detection to maintain visibility and control.
Adopting these log management best practices is an investment in operational excellence. It empowers your developers with the insights they need to build better software, equips your security team with the data to fend off threats, and provides your leadership with the confidence that your systems are reliable, secure, and performant.
Ready to transform your log management strategy but need the expert talent to execute it? OpsMoon connects you with a global network of elite, pre-vetted freelance SRE and DevOps engineers who specialize in building and scaling world-class observability platforms. Let us help you find the right expert to implement these best practices and turn your logs into your most powerful operational asset. Book a free consultation today to start building your dream DevOps team.