A Practical Guide to Prometheus Service Monitoring
 By opsmoon
Master Prometheus service monitoring with our practical guide. Learn to configure, instrument, alert, and scale your observability for real-world applications.
Prometheus is an open-source monitoring and alerting toolkit designed for reliability and scalability. It operates on a pull-based model, actively scraping time-series data from configured endpoints over HTTP. This approach is highly effective in dynamic, cloud-native environments, providing a robust foundation for a comprehensive observability platform.
Understanding Your Prometheus Monitoring Architecture
Before deploying Prometheus, it is crucial to understand its core components and data flow. The architecture is centered around the Prometheus server, which handles metric scraping, storage, and querying. However, the server does not interface directly with your services.
Instead, it utilizes exporters—specialized agents that run alongside target applications (e.g., a PostgreSQL database or a Redis cache). An exporter's function is to translate the internal metrics of a service into the Prometheus exposition format and expose them via an HTTP endpoint for the server to scrape.
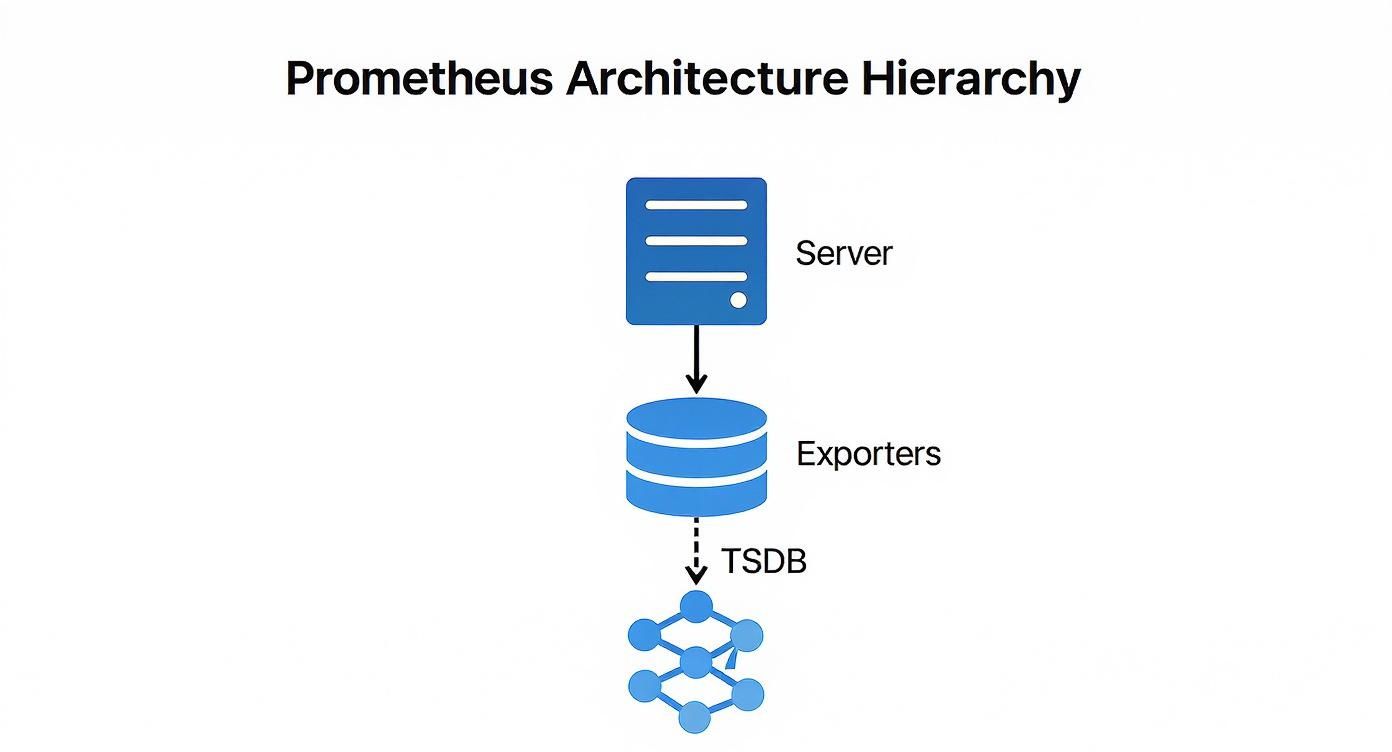
This decoupled architecture creates a resilient and efficient data pipeline. The primary components include:
- Prometheus Server: The core component responsible for service discovery, metric scraping, and storing time-series data.
- Exporters: Sidecar processes that convert third-party system metrics into the Prometheus format.
- Time-Series Database (TSDB): An integrated, highly efficient on-disk storage engine optimized for the high-volume, high-velocity nature of metric data.
- PromQL (Prometheus Query Language): A powerful and expressive functional query language for selecting and aggregating time-series data in real-time.
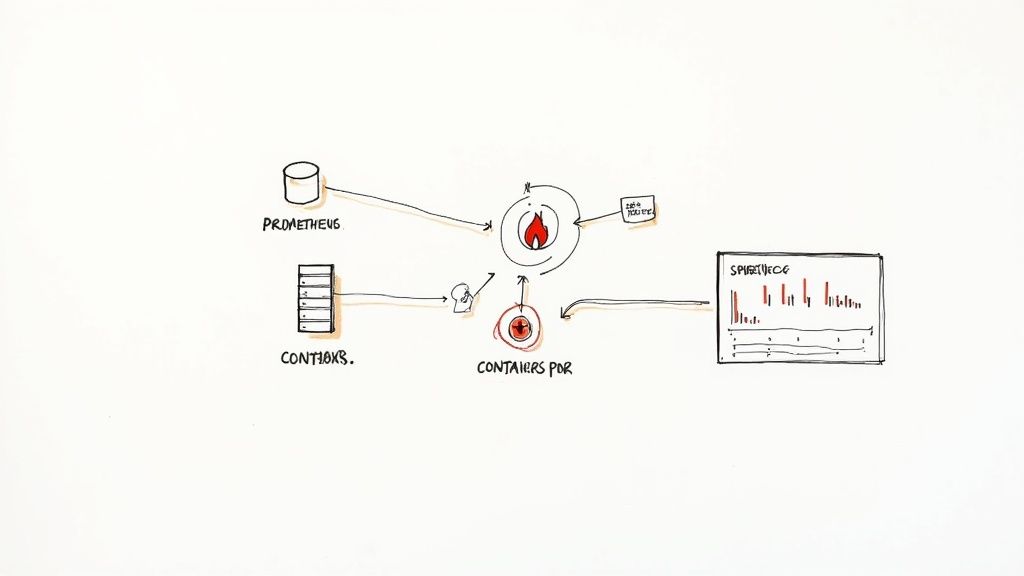
The following diagram illustrates the high-level data flow, where the server discovers targets, pulls metrics from exporters, and stores the data in its local TSDB.
This architecture emphasizes decoupling: the Prometheus server discovers and pulls data without requiring any modification to the monitored services, which remain agnostic of the monitoring system.
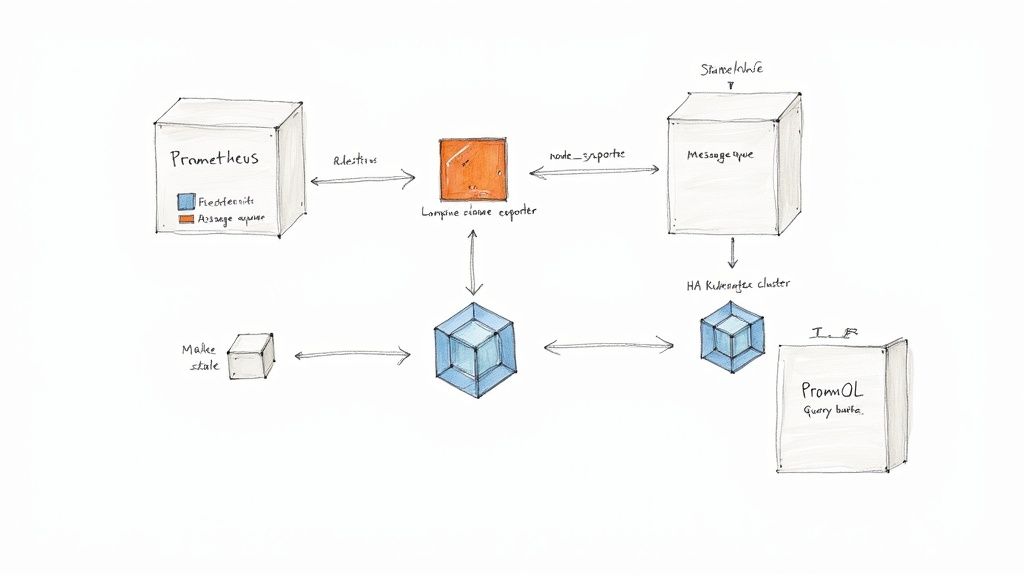
Prometheus Deployment Models Compared
Prometheus offers flexible deployment models that can scale from small projects to large, enterprise-grade systems. Selecting the appropriate model is critical for performance, reliability, and maintainability.
This table provides a technical comparison of common deployment architectures to help you align your operational requirements with a suitable pattern.
| Deployment Model | Best For | Complexity | Scalability & HA |
|---|---|---|---|
| Standalone | Small to medium-sized setups, single teams, or initial PoCs. | Low | Limited; relies on a single server. |
| Kubernetes Native | Containerized workloads running on Kubernetes. | Medium | High; leverages Kubernetes for scaling, discovery, and resilience. |
| Federation | Large, globally distributed organizations with multiple teams or data centers. | High | Good for hierarchical aggregation, but not a full HA solution. |
| Remote Storage | Long-term data retention, global query views, and high availability. | High | Excellent; offloads storage to durable systems like Thanos or Mimir. |
The progression is logical: start with a standalone instance for simplicity, transition to a Kubernetes-native model with container adoption, and implement remote storage solutions like Thanos or Mimir when long-term retention and high availability become non-negotiable. For complex deployments, engaging professional https://opsmoon.com/services/prometheus can prevent costly architectural mistakes.
For massive scale or long-term data retention, you’ll need to think beyond a single instance. This is where advanced architectures like federation—where one Prometheus server scrapes aggregated data from others—or remote storage solutions come into play.
The Dominance of Prometheus in Modern Monitoring
Prometheus's widespread adoption is a result of its robust feature set and vibrant open-source community, establishing it as a de facto standard for cloud-native observability. To leverage it effectively, it's important to understand its position among the best IT infrastructure monitoring tools.
Industry data confirms its prevalence: 86% of organizations utilize Prometheus, with 67% running it in production environments. With an 11.02% market share, it is a key technology in the observability landscape. As over half of all companies plan to increase their investment, its influence is set to expand further. Grafana's observability survey provides additional data on these industry trends.
Automating Discovery and Metric Scraping
In dynamic infrastructures where services and containers are ephemeral, manual configuration of scrape targets is not only inefficient but fundamentally unscalable. This is a critical problem solved by automated service discovery.
Instead of maintaining a static list of scrape targets, Prometheus can be configured to dynamically query platforms like Kubernetes or AWS to discover active targets. This transforms your monitoring system from a brittle, manually maintained configuration into a self-adapting platform. As new services are deployed, Prometheus automatically discovers and begins scraping them, eliminating configuration drift and operational toil. This process is orchestrated within the scrape_configs section of your prometheus.yml file.
Mastering Service Discovery in Kubernetes
For Kubernetes-native workloads, kubernetes_sd_config is the primary mechanism for service discovery. It allows Prometheus to interface directly with the Kubernetes API server to discover pods, services, endpoints, ingresses, and nodes as potential scrape targets.
When a new pod is scheduled, Prometheus can discover it and immediately begin scraping its /metrics endpoint, provided it has the appropriate annotations. This integration is seamless and highly automated.
Consider this prometheus.yml configuration snippet that discovers pods annotated for scraping:
scrape_configs:
  - job_name: 'kubernetes-pods'
    kubernetes_sd_configs:
      - role: pod
    relabel_configs:
      # Keep pods that have the annotation prometheus.io/scrape="true".
      - source_labels: [__meta_kubernetes_pod_annotation_prometheus_io_scrape]
        action: keep
        regex: true
      # Use the pod's IP and the scrape port from an annotation to form the target address.
      - source_labels: [__meta_kubernetes_pod_ip, __meta_kubernetes_pod_annotation_prometheus_io_port]
        action: replace
        regex: (.+);(.+)
        replacement: ${1}:${2}
        target_label: __address__
      # Drop the default kubernetes service address.
      - action: labelmap
        regex: __meta_kubernetes_pod_label_(.+)
      # Create a 'namespace' label from the pod's namespace metadata.
      - source_labels: [__meta_kubernetes_namespace]
        target_label: namespace
      # Create a 'pod' label from the pod's name metadata.
      - source_labels: [__meta_kubernetes_pod_name]
        target_label: pod
This configuration demonstrates the power of relabel_configs, which transforms metadata discovered from the Kubernetes API into a clean and consistent label set for the resulting time-series data. If you are new to this concept, understanding what service discovery is is fundamental to operating modern infrastructure.
Pro Tip: Always filter targets before you scrape them. Using an
action: keeprule based on an annotation or label stops Prometheus from even trying to scrape irrelevant targets. This cuts down on unnecessary load on your Prometheus server, your network, and the targets themselves.
Adapting Discovery for Cloud and Legacy Systems
Prometheus provides service discovery mechanisms for a wide range of environments beyond Kubernetes.
- AWS EC2: For VM-based workloads,
ec2_sd_configenables Prometheus to query the AWS API and discover instances based on tags, instance types, or VPC IDs. This automates monitoring across large fleets of virtual machines. - File-Based Discovery: For legacy systems or environments without native integration,
file_sd_configsis a versatile solution. Prometheus monitors a JSON or YAML file for a list of targets and their labels. You can then use a separate process, like a simple cron job or a configuration management tool, to dynamically generate this file, effectively creating a custom service discovery mechanism.
The Power of Relabeling
Relabeling is arguably the most powerful feature within Prometheus scrape configuration. It provides a rule-based engine to modify label sets at two critical stages of the data pipeline:
relabel_configs: Executed on a target's label set before the scrape occurs.metric_relabel_configs: Executed on a metric's label set after the scrape but before ingestion into the TSDB.
Common use cases for relabel_configs include:
- Filtering Targets: Using
keepordropactions to selectively scrape targets based on metadata labels. - Standardizing Labels: Enforcing consistent label schemas across disparate environments. For example, mapping a cloud provider tag like
__meta_ec2_tag_environmentto a standardenvlabel. - Constructing the Target Address: Assembling the final
__address__scrape target from multiple metadata labels, such as a hostname and a port number.
Mastering service discovery and relabeling elevates your Prometheus service monitoring from a reactive task to a resilient, automated system that scales dynamically with your infrastructure, significantly reducing operational overhead.
Instrumenting Applications with Custom Metrics
While infrastructure metrics provide a valuable baseline, true observability with Prometheus is achieved by instrumenting applications to expose custom, business-specific metrics. This requires moving beyond standard resource metrics like CPU and memory to track the internal state and performance indicators that define your service's health.
There are two primary methods for exposing custom metrics: directly instrumenting your application code using client libraries, or deploying an exporter for third-party services you do not control.
Direct Instrumentation with Client Libraries
When you have access to the application's source code, direct instrumentation is the most effective approach. Official and community-supported client libraries are available for most major programming languages, making it straightforward to integrate custom metric collection directly into your application logic. This allows for the creation of highly specific, context-rich metrics.
These libraries provide implementations of the four core Prometheus metric types:
- Counter: A cumulative metric that only increases, used for values like
http_requests_totalortasks_completed_total. - Gauge: A metric representing a single numerical value that can arbitrarily go up and down, such as
active_database_connectionsorcpu_temperature_celsius. - Histogram: Samples observations (e.g., request durations) and counts them in configurable buckets. It also provides a
_sumand_countof all observations, enabling server-side calculation of quantiles (e.g., p95, p99) and average latencies. - Summary: Similar to a histogram, it samples observations but calculates configurable quantiles on the client side and exposes them directly. Histograms are generally preferred due to their aggregability across instances.
To illustrate, here is how you can instrument a Python Flask application to measure API request latency using a histogram with the prometheus-client library:
from flask import Flask, request
from prometheus_client import Histogram, make_wsgi_app, Counter

app = Flask(__name__)
# Create a histogram to track request latency.
REQUEST_LATENCY = Histogram(
    'http_request_latency_seconds',
    'HTTP Request Latency',
    ['method', 'endpoint']
)
# Create a counter for total requests.
REQUEST_COUNT = Counter(
    'http_requests_total',
    'Total HTTP Requests',
    ['method', 'endpoint', 'http_status']
)

@app.route('/api/data')
def get_data():
    with REQUEST_LATENCY.labels(method=request.method, endpoint='/api/data').time():
        # Your application logic here
        status_code = 200
        REQUEST_COUNT.labels(
            method=request.method,
            endpoint='/api/data',
            http_status=status_code
        ).inc()
        return ({"status": "ok"}, status_code)

# Expose the /metrics endpoint.
app.wsgi_app = make_wsgi_app(app.wsgi_app)
In this example, the REQUEST_LATENCY histogram automatically records the execution time for the /api/data endpoint, while the REQUEST_COUNT counter tracks the total requests with dimensional labels for method, endpoint, and status code.
Using Exporters for Third-Party Services
For services where you cannot modify the source code—such as databases, message queues, or hardware—exporters are the solution. An exporter is a standalone process that runs alongside the target service, queries it for internal metrics, and translates them into the Prometheus exposition format on a /metrics endpoint.
The principle is simple: if you can't make the service speak Prometheus, run a translator next to it. This pattern opens the door to monitoring virtually any piece of software, from databases and message brokers to hardware devices.
A foundational exporter for any Prometheus deployment is the node_exporter. It provides detailed host-level metrics, including CPU usage, memory, disk I/O, and network statistics, forming the bedrock of infrastructure monitoring.
For a more specialized example, monitoring a PostgreSQL database requires deploying the postgres_exporter. This exporter connects to the database and executes queries against internal statistics views (e.g., pg_stat_database, pg_stat_activity) to expose hundreds of valuable metrics, such as active connections, query rates, cache hit ratios, and transaction statistics. This provides deep visibility into database performance that is unattainable from external observation alone.
By combining direct instrumentation of your services with a suite of exporters for dependencies, you create a comprehensive and multi-layered view of your entire system. This rich, application-level data is essential for advanced Prometheus service monitoring and effective incident response.
Building an Actionable Alerting Pipeline
Metric collection is only the first step; the ultimate goal is to convert this data into timely, actionable alerts. An effective alerting pipeline is critical for operational excellence in Prometheus service monitoring, enabling teams to respond to real problems while avoiding alert fatigue.
This is achieved by defining precise alert rules in Prometheus and then using Alertmanager to handle sophisticated routing, grouping, and silencing. The most effective strategy is symptom-based alerting, which focuses on user-facing issues like high error rates or increased latency, rather than on underlying causes like transient CPU spikes. This approach directly ties alerts to Service Level Objectives (SLOs) and user impact.
Crafting Effective Alert Rules
Alerting rules are defined in YAML files and referenced in your prometheus.yml configuration. These rules consist of a PromQL expression that, when it evaluates to true for a specified duration, fires an alert.
Consider a rule to monitor the HTTP 5xx error rate of a critical API. The goal is to alert only when the error rate exceeds a sustained threshold, not on intermittent failures.
This rule will fire if the rate of 5xx errors for the api-service job exceeds 5% for a continuous period of five minutes:
groups:
- name: api-alerts
  rules:
  - alert: HighApiErrorRate
    expr: |
      sum(rate(http_requests_total{job="api-service", code=~"5.."}[5m])) by (instance)
      /
      sum(rate(http_requests_total{job="api-service"}[5m])) by (instance)
      * 100 > 5
    for: 5m
    labels:
      severity: critical
    annotations:
      summary: "High API Error Rate (instance {{ $labels.instance }})"
      description: "The API service on instance {{ $labels.instance }} is experiencing an error rate greater than 5%."
      runbook_url: "https://internal.my-company.com/runbooks/api-service-high-error-rate"
The
forclause is your best friend for preventing "flapping" alerts. By demanding the condition holds true for a sustained period, you filter out those transient spikes. This ensures you only get woken up for persistent, actionable problems.
Intelligent Routing with Alertmanager
Once an alert fires, Prometheus forwards it to Alertmanager. Alertmanager is a separate component responsible for deduplicating, grouping, silencing, inhibiting, and routing alerts based on a declarative configuration file, alertmanager.yml. A strong understanding of the Prometheus Query Language is essential for writing both the alert expressions and the matching logic used by Alertmanager.
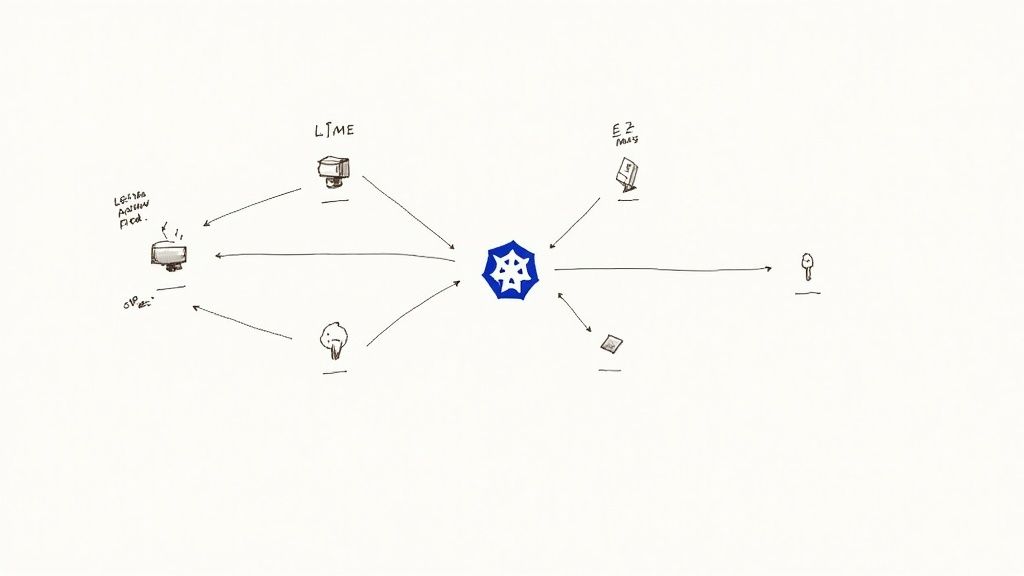
This diagram illustrates Alertmanager's central role in the alerting workflow.
Alertmanager acts as a central dispatcher, applying logic to the alert stream before notifying humans. For example, a well-structured alertmanager.yml can define a routing tree that directs database-related alerts (service="database") to a PagerDuty endpoint for the SRE team, while application errors (service="api") are sent to a specific Slack channel for the development team.
Preventing Alert Storms with Inhibition
One of Alertmanager's most critical features for managing large-scale incidents is inhibition. During a major outage, such as a database failure, a cascade of downstream services will also fail, generating a storm of alerts. This noise makes it difficult for on-call engineers to identify the root cause.
Inhibition rules solve this problem. You can configure a rule that states if a high-severity alert like DatabaseDown is firing, all lower-severity alerts that share the same cluster or service label (e.g., ApiErrorRate) should be suppressed. This immediately silences the downstream noise, allowing engineers to focus on the core issue.
Visualizing Service Health with Grafana Dashboards
Time-series data is most valuable when it is visualized. Grafana is the de facto standard for visualizing Prometheus metrics, transforming raw data streams into intuitive, real-time dashboards. This makes Prometheus service monitoring accessible to a broader audience, including developers, product managers, and executives.
Grafana's native Prometheus data source provides seamless integration, allowing you to build rich visualizations of service health, performance, and business KPIs.
Connecting Prometheus to Grafana
The initial setup is straightforward. In Grafana, you add a new "Prometheus" data source and provide the HTTP URL of your Prometheus server (e.g., http://prometheus-server:9090). Grafana will then be able to execute PromQL queries directly against your Prometheus instance.
Building Your First Service Dashboard
A well-designed dashboard should answer key questions about a service's health at a glance: Is it available? Is it performing well? Is it generating errors? To create effective visualizations, it's beneficial to review data visualization best practices.
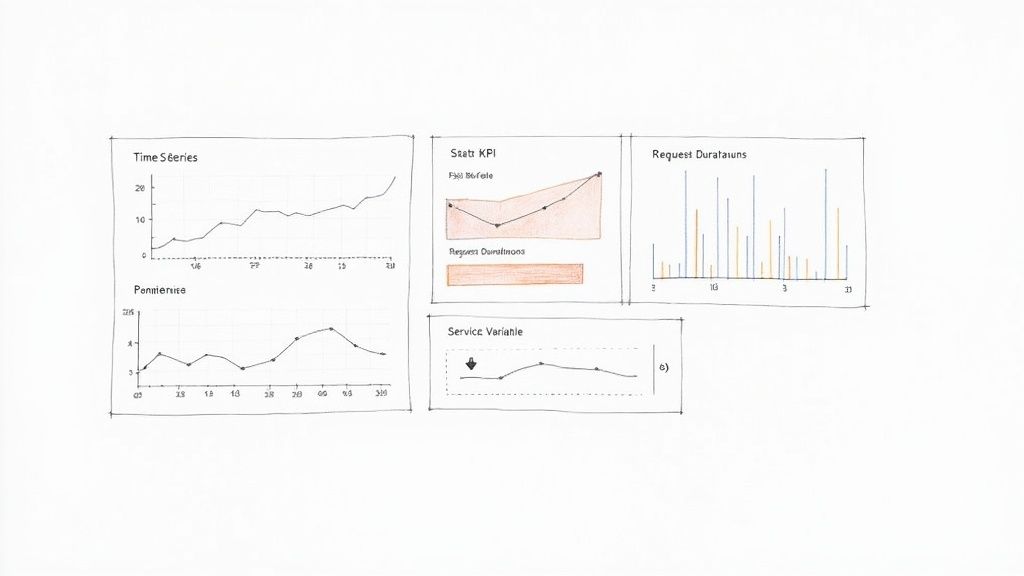
A typical service dashboard combines several panel types:
- Stat Panels: For displaying single, critical KPIs like "Current Error Rate" or "95th Percentile Latency."
- Time Series Graphs: The standard for visualizing trends over time, such as request volume, CPU utilization, or latency distributions.
- Gauges: For providing an at-a-glance view of resource utilization against a maximum, like "Active Database Connections."
For an API service dashboard, you could create a Stat Panel to display the current requests per second using the PromQL query: sum(rate(http_requests_total{job="api-service"}[5m])).
Next, a Time Series Graph could visualize the 95th percentile latency, offering insight into the user-perceived performance. The query for this is more complex, leveraging the histogram metric type: histogram_quantile(0.95, sum(rate(http_request_duration_seconds_bucket{job="api-service"}[5m])) by (le)).
By combining different panel types, you're not just showing data; you're building a narrative. The stat panel tells you what's happening right now, while the time-series graph provides the historical context to know if that "right now" is normal or an anomaly.
Creating Dynamic Dashboards with Variables
Static dashboards are useful, but their utility multiplies with the use of variables. Grafana variables enable the creation of interactive filters, allowing users to dynamically select which service, environment, or instance to view without modifying the underlying PromQL queries.
For instance, you can define a variable named $job that populates a dropdown with all job labels from your Prometheus server using the query label_values(up, job).
You can then update your panel queries to use this variable: sum(rate(http_requests_total{job="$job"}[5m])). This single dashboard can now display metrics for any service, dramatically reducing dashboard sprawl and increasing the utility of your monitoring platform for the entire organization.
Scaling Prometheus for Long-Term Growth
A single Prometheus instance will eventually encounter scalability limits related to ingestion rate, storage capacity, and query performance. A forward-looking Prometheus service monitoring strategy must address high availability (HA), long-term data storage, and performance optimization.
Once Prometheus becomes a critical component of your incident response workflow, a single point of failure is unacceptable. The standard approach to high availability is to run two identical Prometheus instances in an HA pair. Both instances scrape the same targets and independently evaluate alerting rules. They forward identical alerts to Alertmanager, which then deduplicates them, ensuring that notifications are sent only once.
Unlocking Long-Term Storage with Remote Write
Prometheus's local TSDB is highly optimized for fast, short-term queries but is not designed for multi-year data retention. To achieve long-term storage and a global query view across multiple clusters, you must forward metrics to a dedicated remote storage backend using the remote_write feature.
This protocol allows Prometheus to stream all ingested samples in real-time to a compatible remote endpoint. Leading open-source solutions in this space include Thanos, Cortex, and Mimir, which provide durable, scalable, and queryable long-term storage.
Configuration is handled in prometheus.yml:
global:
  scrape_interval: 15s

remote_write:
  - url: "http://thanos-receiver.monitoring.svc.cluster.local:19291/api/v1/receive"
    queue_config:
      max_shards: 1000
      min_shards: 1
      max_samples_per_send: 500
      capacity: 10000
      min_backoff: 30ms
      max_backoff: 100ms
This configuration directs Prometheus to forward samples to a Thanos Receiver endpoint. The queue_config parameters are crucial for resilience, managing an in-memory buffer to handle network latency or temporary endpoint unavailability.
By decoupling the act of scraping from the job of long-term storage,
remote_writeeffectively turns Prometheus into a lightweight, stateless agent. This makes your local Prometheus instances far easier to manage and scale, as they're no longer bogged down by the burden of holding onto data forever.
Considering Prometheus Federation
Federation is another scaling pattern, often used in large, geographically distributed organizations. In this model, a central Prometheus server scrapes aggregated time-series data from lower-level Prometheus instances. It is not a substitute for a remote storage solution but is useful for creating a high-level, global overview of key service level indicators (SLIs) from multiple clusters or data centers.
Taming High Cardinality Metrics
One of the most significant performance challenges at scale is high cardinality. This occurs when a metric has a large number of unique label combinations, leading to an explosion in the number of distinct time series stored in the TSDB. Common culprits include labels with unbounded values, such as user_id, request_id, or container IDs.
High cardinality can severely degrade performance, causing slow queries, high memory consumption, and even server instability. Proactive cardinality management is essential.
- Audit Your Metrics: Regularly use PromQL queries like
topk(10, count by (__name__)({__name__=~".+"}))to identify metrics with the highest series counts. - Use
metric_relabel_configs: Drop unnecessary labels or entire high-cardinality metrics at the scrape level before they are ingested. - Instrument with Care: Be deliberate when adding labels to custom metrics. Only include dimensions that are essential for alerting or dashboarding.
Securing Your Monitoring Endpoints
By default, Prometheus and exporter endpoints are unencrypted and unauthenticated. In a production environment, this is a significant security risk. These endpoints must be secured. A common and effective approach is to place Prometheus and its components behind a reverse proxy (e.g., Nginx or Traefik) to handle TLS termination and enforce authentication (e.g., Basic Auth or OAuth2).
The operational complexity of managing a large-scale Prometheus deployment has led to the rapid growth of the managed Prometheus services market, valued at USD 1.38 billion. Organizations are increasingly offloading the management of their observability infrastructure to specialized providers to reduce operational burden. This detailed report provides further insight into this market trend.
By implementing a high-availability architecture, leveraging remote storage, and maintaining discipline around cardinality and security, you can build a scalable Prometheus platform that supports your organization's growth.
At OpsMoon, we specialize in building and managing robust observability platforms that scale with your business. Our experts can help you design and implement a Prometheus architecture that is reliable, secure, and ready for future growth. Get started with a free work planning session today.