Application Performance Monitoring Tools Comparison: A Technical Guide for Engineers
 By opsmoon
Discover the ultimate application performance monitoring tools comparison to choose the best solutions for your engineering needs. Read our guide now!
When you start digging into an application performance monitoring tools comparison, you hit one truth pretty fast: the best tool is completely situational. It all comes down to your tech stack, your deployment architecture, and your team's operational maturity.
Some tools are wizards at automated root cause analysis in a chaotic Kubernetes environment. Others are phenomenal at deep code-level profiling for a monolithic Java application. There's no one-size-fits-all answer. This guide provides a technical framework to help you make an informed decision.
Why The Right APM Tool Is a Strategic Imperative
Selecting an Application Performance Monitoring (APM) tool is a critical engineering decision, not just another item on a procurement checklist. With the proliferation of distributed systems, microservices, and ephemeral cloud-native environments, legacy, siloed monitoring approaches are fundamentally broken.
A single user-facing request can now traverse dozens of services, message queues, and databases. Manually tracing a high-latency transaction through this distributed call graph during an incident is technically infeasible and a waste of valuable engineering time.
This complexity directly impacts the business. A performance degradation that was once a minor annoyance can now cause cascading failures, leading to measurable revenue loss, increased customer churn, and a damaged brand reputation. A robust APM strategy provides the deep, actionable telemetry required to understand what is actually happening inside your production systems.
The Core Pillars of Modern APM
Modern APM is built on three foundational pillars of observability. A technical application performance monitoring tools comparison must start with an assessment of how a tool implements these concepts.
- Distributed Tracing: This is the backbone of microservice analysis. It reconstructs the end-to-end journey of a request as it propagates across service boundaries, databases, and third-party APIs. By correlating parent and child spans, it transforms a series of isolated events into a coherent, causal narrative of a single transaction.
- Real-User Monitoring (RUM): RUM provides client-side performance telemetry directly from the end-user's browser or mobile device. It captures critical metrics like First Contentful Paint (FCP), Largest Contentful Paint (LCP), and Interaction to Next Paint (INP), along with JavaScript errors, providing an unvarnished view of the actual user experience.
- AIOps (AI for IT Operations): Modern applications generate a deluge of telemetry data (logs, metrics, traces). AIOps leverages machine learning algorithms to automate the analysis of this data. It performs tasks like dynamic baselining, anomaly detection, event correlation, and root cause identification, reducing the cognitive load on engineers.
The market reflects this growing need for deep visibility. The application metrics and monitoring tools market, valued at USD 12.88 billion in 2025, is projected to rocket to USD 37.78 billion by 2035. This growth is fueled by the widespread adoption of microservices and the engineering demand for real-time, high-cardinality data analysis.
A great APM tool does more than just spot errors; it helps you tackle deep-seated problems. It’s brilliant for uncovering the hidden cost of technical debt and legacy software. By quantifying the latency impact of a poorly designed module or an N+1 query pattern, it provides the hard data needed to justify refactoring efforts.
Ultimately, choosing the right APM platform is about transforming an engineering team's posture from reactive firefighting to proactive, data-driven system optimization.
Defining Your APM Evaluation Framework
Before you begin a proof-of-concept for any specific application performance monitoring tools, you must establish a technical evaluation framework. It is easy to be swayed by slick user interfaces or marketing claims, but these do not reveal a tool's underlying capabilities or limitations.
A well-defined framework forces you and your team to agree on a concrete set of technical requirements and success criteria for your specific environment. This ensures you make a data-driven choice based on technical merit, not vendor promises.
Core Technical Capabilities
The primary function of an APM tool is to provide deep visibility into your application's runtime behavior. Your first task is to assess the depth and quality of this visibility and its compatibility with your technology stack.
Here are the technical fundamentals you must evaluate:
- Code-Level Visibility: Can the tool's profiler pinpoint the exact function, method, or SQL query that is a performance bottleneck? Can it do this in production with minimal performance overhead? This is the critical difference between knowing a service endpoint is slow and knowing it's because of a specific inefficient algorithm or a database query missing an index.
- Distributed Tracing Quality: How effectively does the tool propagate trace context across a polyglot environment—for example, from a Go service to a Python API via a Kafka message queue? Scrutinize its auto-instrumentation capabilities versus the amount of manual code modification required. A tool that automatically handles context propagation across different protocols (HTTP, gRPC, messaging) will dramatically reduce your mean time to resolution (MTTR).
- Automated Root Cause Analysis: The best tools use AI/ML to go beyond simple alerting. You need to assess how effectively the platform correlates events, linking a user-facing symptom (e.g., high latency) back to a specific root cause like a new code deployment, a configuration change, or an infrastructure failure.
A huge mistake I see teams make is underestimating the challenges of distributed tracing in a real-world, high-load environment. A demo with three clean microservices always looks great. But what happens when you have hundreds of services, trace sampling kicking in, and context being dropped by un-instrumented legacy components? That's the real test of a tool's robustness.
Non-Functional Requirements and Scalability
A tool's features are only one part of the equation. The other is how it integrates into your operational workflows and whether its architecture can scale with your application's growth.
Consider these operational and deployment aspects:
- Deployment Model (Agent-Based vs. Agentless): Agent-based tools typically offer deeper insights (e.g., memory profiling, process-level metrics) but require installing and managing agents on every host or container. This introduces operational overhead and a potential point of failure. Agentless approaches, often leveraging standards like OpenTelemetry, offer greater flexibility and reduced footprint but may not provide the same depth of out-of-the-box visibility.
- Data Ingestion and Scalability: How does the platform's data ingestion pipeline handle massive telemetry bursts during peak traffic? Investigate its architecture for potential bottlenecks. Does it use a scalable message queue? Is its data store optimized for high-cardinality time-series data? A tool that drops data or experiences high query latency during a production incident has failed its primary mission.
- Extensibility and Integrations: No tool is an island. Verify the existence of robust, pre-built integrations with your existing toolchain—your CI/CD system (e.g., Jenkins, GitLab CI), alerting platforms (e.g., PagerDuty), and incident management software (e.g., Jira). Equally important, evaluate its APIs. Can you programmatically query telemetry data or configure alerting?
Finally, you must look past the sticker price and calculate the real Total Cost of Ownership (TCO). This includes not just the license fee, but also data ingestion and retention costs, the engineering hours required for implementation and instrumentation, and the ongoing operational burden of maintenance and training.
Key Evaluation Criteria for APM Tools
To formalize your evaluation, use a clear checklist or scorecard. The table below summarizes key technical and business criteria to guide your decision-making process.
| Evaluation Category | Key Features to Assess | Business Impact |
|---|---|---|
| Observability Depth | Code-level profiling, database query analysis, support for polyglot tracing, infrastructure correlation. | Reduces Mean Time to Resolution (MTTR) by pinpointing the exact source of performance issues. |
| AI & Automation | Automated root cause analysis, anomaly detection, predictive alerting, deployment change tracking. | Frees up engineering time from manual troubleshooting; enables proactive problem-solving. |
| Deployment & Scalability | Agent vs. agentless options, data ingestion limits, architecture resilience, support for containers/serverless. | Ensures the tool can grow with your application and won't become a bottleneck itself. |
| Integration Ecosystem | Pre-built integrations (Slack, PagerDuty, Jira), API quality and documentation, support for OpenTelemetry. | Fits smoothly into existing workflows, preventing tool silos and manual data correlation. |
| Cost & Ownership | Licensing model (per host, per user), data retention costs, implementation effort, training requirements. | Provides a clear picture of the Total Cost of Ownership (TCO), not just the upfront price. |
Using a structured framework like this ensures that every stakeholder, from engineering to finance, is evaluating the tools on the same terms. It moves the conversation from "Which one looks coolest?" to "Which one actually solves our problems most effectively?"
Technical Deep Dive: A Side-by-Side APM Tool Comparison
Alright, this is where the rubber meets the road. A real application performance monitoring tools comparison means getting technical and looking at how these platforms actually work under the hood. We're going to break down the core architectural philosophies and key technical differentiators of four major players: Dynatrace, New Relic, Datadog, and AppDynamics.
Paying attention to these details is critical. One tool might excel at automatic service discovery in a dynamic Kubernetes environment, while another provides unparalleled transaction mapping for a complex, monolithic enterprise application. Your optimal choice depends entirely on your technology stack and engineering objectives.
Architectural Philosophy and Data Collection
The core of any APM tool is its telemetry collection mechanism. This fundamental architectural decision profoundly impacts the depth of visibility you get and the operational overhead you incur.
- Dynatrace (OneAgent Approach): Dynatrace’s key differentiator is its OneAgent. You install this single binary on a host, and it automatically discovers and injects itself into running processes to capture traces, metrics, and logs. This provides deep, automatic visibility with minimal manual configuration, which is a significant advantage in complex, ephemeral environments.
- New Relic (Agent-Based, Unified Telemetry): New Relic also uses language-specific agents but funnels all data into its central Telemetry Data Platform. The power here lies in its queryability (via NRQL), offering immense flexibility for creating custom dashboards and ad-hoc analysis. The trade-off is that it can require more initial effort to configure and deploy the various agents correctly.
- Datadog (Unified Agent, Strong on Infrastructure): Datadog originated as an infrastructure monitoring platform and has expanded into APM. Its unified agent is exceptional at collecting metrics from hosts, containers, and a vast ecosystem of integrations. While its APM capabilities are robust, its architecture still reflects this infrastructure-centric heritage.
- AppDynamics (Business Transaction Centric): AppDynamics, a part of Cisco, models the world around business transactions. It focuses on tracing a user-initiated workflow—like "Process Payment"—from end to end. This approach is highly effective for large enterprises where mapping application performance directly to business outcomes is a primary requirement.
A key difference becomes clear right away: Dynatrace is all about automated discovery and dependency mapping out-of-the-box. Datadog prioritizes flexibility and tight integration with infrastructure data. New Relic gives you a powerful, queryable data firehose, and AppDynamics builds its entire universe around pre-defined business transactions.
AI and Root Cause Analysis: The Battle of the Bots
Modern applications are too complex for manual root cause analysis. This is where AIOps comes in, but the "intelligence" layer is a major point of differentiation among these tools.
Dynatrace's Davis AI vs. Datadog's Watchdog
This is one of the most significant technical comparisons in the APM space.
- Davis (Dynatrace): Davis is a deterministic AI engine. It leverages the rich, real-time dependency map (Smartscape) generated by OneAgent to understand the precise cause-and-effect relationships within your stack. When an issue occurs, Davis doesn't just find correlations; it traces the causal path. It can state with high confidence, "This user-facing slowdown was caused by a garbage collection pause in this specific JVM, which was triggered by a memory leak introduced in the last deployment."
- Watchdog (Datadog): Watchdog is a probabilistic machine learning engine. It continuously analyzes all telemetry streams to automatically detect anomalies and surface "unknown unknowns." It excels at identifying deviations from normal patterns in logs and metrics. However, its root cause analysis is more about highlighting strong statistical correlations than providing a single, definitive causal explanation like Davis.
New Relic and AppDynamics also have powerful AI capabilities. New Relic’s applied intelligence helps detect anomalies and group related incidents, while AppDynamics' Cognition Engine focuses on connecting performance issues to their business impact. However, the philosophical divide between Davis's deterministic model and Watchdog's probabilistic one is a crucial decision point for many engineering teams. For tips on squeezing the most value out of these platforms, check out our guide on application performance optimization.
This snapshot gives you an idea of how these architectural choices can play out in the real world, affecting metrics like accuracy and response time.
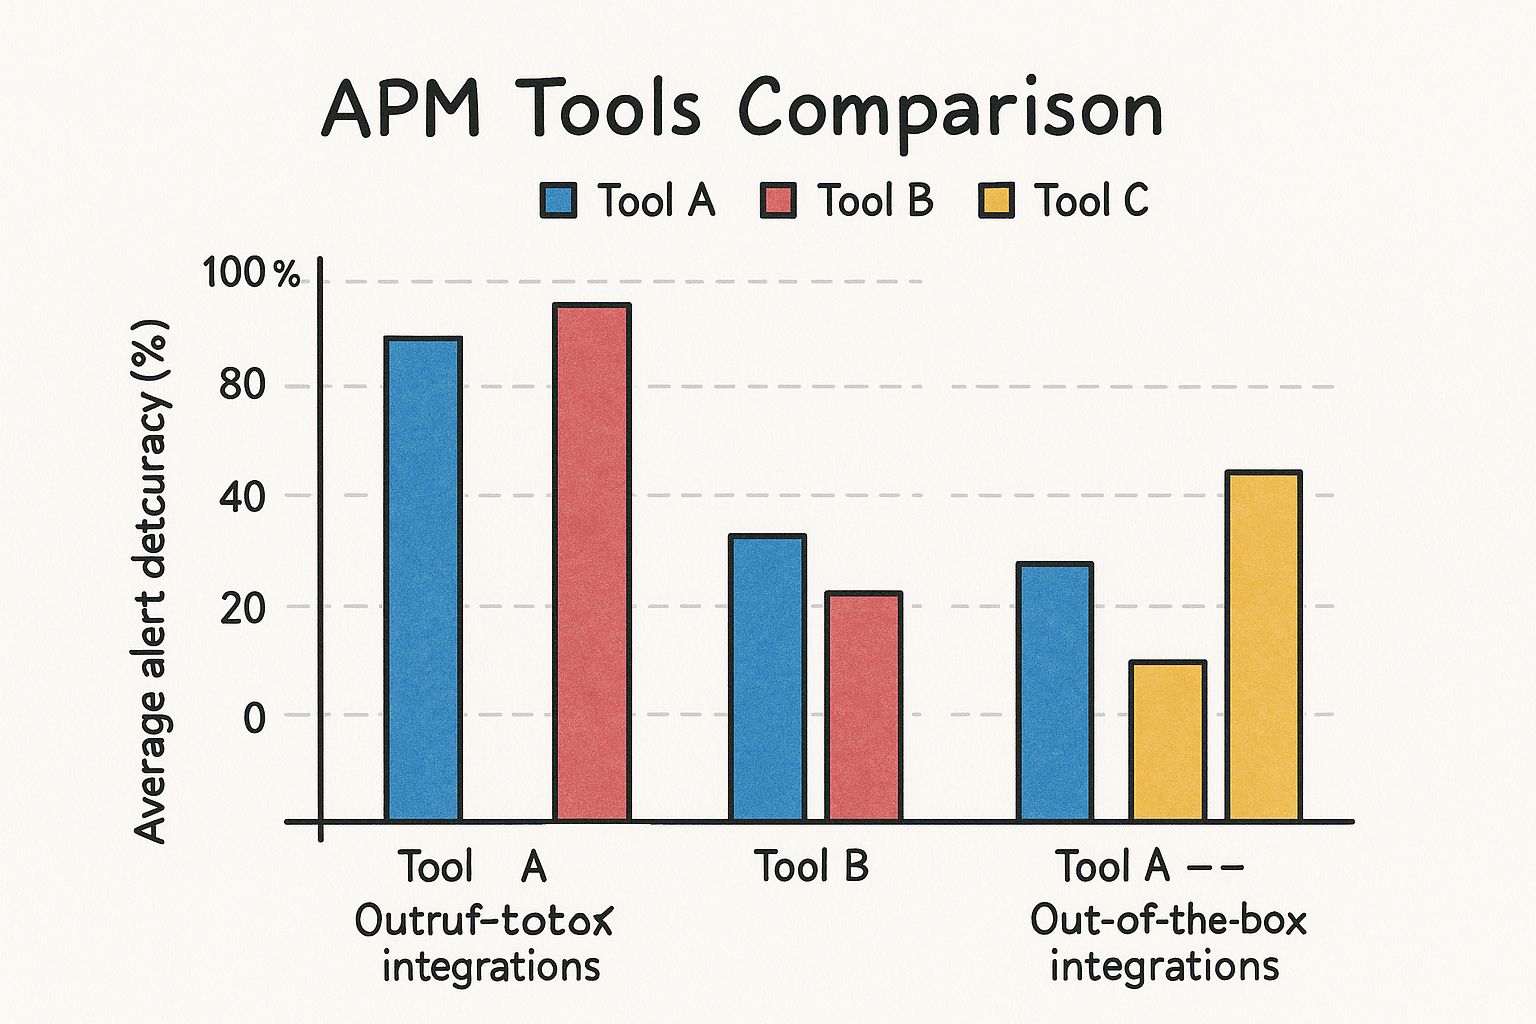
You can see a clear trade-off. Tools that nail anomaly detection with high accuracy might have a slightly longer alert latency. It's a balance you'll need to weigh based on how sensitive your system is to both false alarms and slow responses.
Practical Implementation and Extensibility
A tool’s technical specs are meaningless if it's difficult to implement or doesn't integrate with your existing workflows. Practicality is paramount.
Instrumentation Effort:
- High Automation (Dynatrace): The OneAgent model significantly reduces the manual effort of instrumentation. Teams often report seeing meaningful data within minutes of installation.
- Moderate Effort (New Relic, Datadog): These tools provide excellent auto-instrumentation, but achieving deep visibility often requires more fine-tuning, especially for custom application code or less common frameworks.
- Configuration-Heavy (AppDynamics): Implementing AppDynamics, particularly defining all relevant business transactions, can be a substantial project. This upfront investment yields powerful business-centric reporting but requires significant initial engineering effort.
Ecosystem and Integrations:
Datadog is often considered the leader here, with a massive library of over 700 pre-built integrations. This makes it incredibly simple to ingest data from nearly any service or platform. New Relic and Dynatrace also have extensive integration catalogs, but Datadog's sheer breadth is a major technical advantage.
While we're focused on APM, it helps to see how these fit into the bigger picture of IT infrastructure monitoring tools, which are often the foundation for these application-level insights.
Situational Strengths and Weaknesses
No single tool wins every time. Here’s a quick rundown of where each platform typically shines and where it might struggle, based on its technical DNA.
| Tool | Primary Technical Strength | Best-Fit Scenario | Potential Weakness |
|---|---|---|---|
| Dynatrace | Automated, deterministic root cause analysis via OneAgent and Davis AI. | Complex, dynamic microservices or Kubernetes environments where automation is key. | Can feel like a "black box" because of the high automation; less flexible for custom queries than others. |
| New Relic | All-in-one Telemetry Data Platform with powerful query language (NRQL). | Teams that want to build highly custom dashboards and run deep, ad-hoc queries across all telemetry. | Can have a steeper learning curve; managing multiple agents can add overhead. |
| Datadog | Unmatched number of integrations and strong infrastructure-to-app correlation. | Teams needing a single pane of glass for infra, logs, and APM, especially in diverse tech stacks. | APM can feel less mature than its infra monitoring; probabilistic AI might not satisfy all users. |
| AppDynamics | Deep focus on business transaction monitoring and business impact analysis. | Large enterprises that need to translate tech performance into clear business KPIs for stakeholders. | Can be more complex and costly to implement; may be overkill for teams without a strong business-transaction focus. |
Ultimately, the best application performance monitoring tools comparison is one you run yourself with a proof-of-concept. Use this technical breakdown to shortlist the contenders, then put them to the test on a real, critical application. That’s the only way to see how their philosophies and features hold up in the unforgiving reality of your own environment.
Decoding Pricing Models and Total Cost of Ownership
Here's where things get tricky. An APM tool's real cost is almost never the number you see on the pricing page. That initial quote is merely the starting point. To conduct a meaningful application performance monitoring tools comparison, you must dissect the complex—and often opaque—pricing models that vendors employ.
These models are frequently based on abstract or variable metrics that make a direct, apples-to-apples comparison difficult. Understanding these nuances is essential to avoid significant budget overruns.
Common APM Pricing Metrics
Most modern APM platforms use a blend of metrics, each with different cost implications depending on your architecture.
- Per Host or Host Unit: A classic model where you are billed based on the number of servers or VMs being monitored. Beware of "host units." Some vendors weight these units by memory or CPU, so a single powerful host might consume 16 or 32 units, inflating costs unexpectedly.
- Data Ingestion Volume: Many observability-focused platforms charge based on the volume of telemetry—traces, logs, metrics—ingested per month, typically measured in GB or TB. This offers flexibility but introduces budget volatility, as a buggy service generating excessive logs can lead to a massive, unplanned bill.
- Custom Units: Vendors like Dynatrace use proprietary composite metrics like "Host Unit Hours," which factor in both host memory and monitoring duration. The goal is to align cost with actual usage, but it can make forecasting monthly spend a complex exercise.
The biggest trap here is ignoring the hidden costs. Data overage fees, charges for extended data retention periods, and premium add-on modules for features like security or business analytics can easily double your projected spend. Always scrutinize the contract and service agreement details.
Calculating the True Total Cost of Ownership
To create a realistic budget, you must calculate the Total Cost of Ownership (TCO). This is a comprehensive financial and technical analysis that accounts for all direct and indirect expenses over the tool's lifecycle.
Understanding fundamental software license management best practices is crucial for controlling your TCO. Your TCO framework must include key operational overheads that are often overlooked.
TCO Calculation Framework:
- Implementation Effort: Quantify the engineering hours required for initial deployment. This includes deploying agents, configuring custom instrumentation for proprietary code, and integrating the tool into your CI/CD pipeline. This initial time investment is a significant, real cost.
- Team Training: A tool is ineffective if the team cannot use it proficiently. Factor in the time and resources for training, from basic dashboard navigation to mastering advanced query languages and alert configuration.
- Ongoing Maintenance: Assign a cost to the operational load of updating agents, managing user permissions, and fine-tuning alert configurations to reduce noise. This ongoing effort consumes valuable engineering cycles. This becomes especially clear during complex infrastructure changes, like a database migration, which often demand meticulous planning. For more on that, our article on database migration best practices offers some solid insights into managing that kind of technical overhead.
By building a complete TCO model, you move beyond simple price comparison to a strategic financial decision. This ensures the chosen APM tool is not only a technical fit but also financially sustainable for your organization.
Matching the Right APM Tool to Your Technical Use Case
When you're doing an application performance monitoring tools comparison, the objective isn't to find the "best" tool in a vacuum—it's to find the optimal tool for your specific technical reality. What is a game-changer for a cloud-native startup could be a frustrating and expensive mismatch for a large financial institution. The right choice must align with your architecture, team skills, and business objectives.
This alignment is more critical than ever. The APM market, valued at USD 9.04 billion in 2024, is projected to hit USD 21.30 billion by 2032. This growth is driven by the integration of AI/ML for predictive analytics and sophisticated anomaly detection. You can dig into the specifics in the full research from Data Bridge Market Research.
Let's break down some real-world technical scenarios and identify the best-fit APM solutions.
Use Case 1: The Cloud-Native Startup
Your architecture is modern and ephemeral: Kubernetes, microservices, and serverless functions. Your primary technical requirements are speed of deployment and automated discovery. Your architecture changes constantly, and you lack a dedicated team to manage monitoring infrastructure.
- Top Contender: Dynatrace
- Why It Fits: The OneAgent technology is purpose-built for this scenario. It automatically discovers, instruments, and maps new services and containers as they are deployed, a critical feature in a dynamic environment. For a small engineering team, the deterministic root cause analysis from its Davis AI provides a clear, actionable signal without requiring hours of manual configuration or alert tuning.
Use Case 2: The Large Enterprise with Legacy Systems
You operate in a hybrid environment with modern microservices coexisting with on-premise, monolithic legacy applications. Your key requirements include robust security, support for complex multi-tiered applications, and strong data governance.
- Top Contender: AppDynamics
- Why It Fits: AppDynamics excels at mapping business transactions across both modern and legacy systems. Its strong support for on-premise deployments meets the stringent security and data residency requirements of many large enterprises. Critically, its ability to translate technical performance metrics (e.g., latency, error rates) into business KPIs (e.g., revenue impact) is vital for communicating with non-technical stakeholders. For these environments, folding solid DevOps security best practices into your monitoring strategy is essential.
A key differentiator here is the operational model. A startup needs "set it and forget it" automation. An enterprise needs deep control, custom instrumentation for proprietary code, and robust reporting that speaks the language of business impact.
Use Case 3: The E-commerce Platform
For any e-commerce platform, every millisecond of latency can directly impact revenue. The end-user experience is paramount. Your primary focus is on Real User Monitoring (RUM) and correlating client-side performance with backend behavior.
- Top Contender: New Relic
- Why It Fits: New Relic provides a powerful combination of Browser (RUM) and APM monitoring. It allows you to trace a slow page load experienced by a user back to a specific, inefficient database query or a slow downstream service call. Its powerful query language (NRQL) is a significant advantage, enabling the creation of detailed dashboards that map performance metrics to business funnels, pinpointing where latency is causing customer abandonment.
Use Case 4: The Performance-Critical Microservices Team
Your team owns a set of high-throughput, low-latency microservices, such as a real-time bidding platform or a financial trading system. Your work revolves around deep, code-level diagnostics and the flexibility to correlate telemetry data from diverse sources.
- Top Contender: Datadog
- Why It Fits: Datadog's core strength is its unification of infrastructure metrics, application traces, and logs in a single platform. For a performance-centric team, this correlation is invaluable. You can seamlessly pivot from a latency spike in a trace to the CPU and memory metrics of the specific container that handled the request. Its vast library of integrations allows you to ingest data from virtually any component in your stack, providing unparalleled flexibility for deep-dive investigations.
Common APM Questions from the Trenches
When you're in the weeds comparing application performance monitoring tools, the same questions tend to pop up. These aren't just technical curiosities; the answers shape your entire implementation strategy and determine whether you actually get value from your new tool. Let's tackle the big ones I hear from engineering teams all the time.
What's the Real Difference Between Monitoring, APM, and Observability?
This question comes up constantly, and it’s easy to get tangled in the buzzwords. From a technical standpoint, it's an evolution in the ability to interrogate a system.
-
Monitoring is about tracking pre-defined metrics for known failure modes—the "known-unknowns." You know CPU is a potential bottleneck, so you create a dashboard and an alert for when usage exceeds 90%. It's reactive and based on past experience.
-
APM adds context. It connects the dots between different telemetry signals. It takes that high CPU alert and correlates it with a specific slow transaction, a high error rate, and a recent code deployment. It answers why the monitored metric matters to the application's performance.
-
Observability is the ability to debug novel failure modes—the "unknown-unknowns." It's not about having more dashboards; it's about having sufficiently rich, high-cardinality data (traces, logs, and structured events) that you can ask arbitrary new questions of your system in real-time, without having to ship new code or change instrumentation. Modern APM tools are increasingly built on this principle.
How Hard Is It Really to Implement an APM Tool?
The initial setup can be deceptively simple, but a full implementation is a significant engineering effort.
A modern SaaS tool like Dynatrace with its OneAgent can begin delivering data within minutes. The auto-instrumentation can seem magical.
However, a true enterprise rollout is a multi-stage project. You will be:
- Developing custom instrumentation for proprietary libraries and frameworks.
- Integrating the tool's data with your CI/CD pipeline to automatically tag deployments and correlate them with performance regressions.
- Implementing a robust alerting strategy, carefully tuning thresholds and notification rules to minimize alert fatigue and ensure signals are actionable.
Don’t make the classic mistake of confusing a quick install with a successful implementation. You absolutely need to budget time for a proof-of-concept on a single, important application. That phase alone can take a few weeks and usually needs dedicated engineering time to dial everything in correctly.
Can't We Just Use Open Source Instead of Paying for a Commercial Tool?
Yes, you can. A DIY observability stack using open-source tools like Prometheus for metrics, Grafana for visualization, Jaeger for distributed tracing, and the ELK Stack for logging is incredibly powerful and offers maximum control.
However, this power comes at the cost of engineering hours. You are now responsible for the integration, scaling, maintenance, and security of what are effectively four or more separate, complex distributed systems. The trade-off is your team's time and focus.
Commercial APM platforms provide a unified, managed, out-of-the-box experience. You are paying for the integration, the advanced features like AIOps and automated root cause analysis, and the enterprise-level support. For many organizations, the Total Cost of Ownership (TCO) of a commercial tool is lower once you factor in the engineering headcount required to operate a DIY open-source stack at scale.
Putting together a solid observability stack and navigating an APM implementation is a major undertaking. OpsMoon connects you with top-tier DevOps and SRE experts who have done this a dozen times before. Start with a free work planning session to build your roadmap today.