10 Best Practices for Incident Management in 2025
 By opsmoon
Discover 10 technical and actionable best practices for incident management. Improve reliability and MTTR with our expert guide for DevOps and SRE teams.
In fast-paced DevOps environments, an incident is not a matter of 'if' but 'when'. A minor service disruption can quickly escalate, impacting revenue, customer trust, and team morale. Moving beyond reactive firefighting requires a structured, proactive approach. Effective incident management isn't just about fixing what’s broken; it's a critical discipline that ensures service reliability, protects the user experience, and drives continuous system improvement. Without a formal process, teams are left scrambling, leading to longer downtimes, repeated errors, and engineer burnout.
This guide outlines 10 technical and actionable best practices for incident management, specifically designed for DevOps, SRE, and platform engineering teams looking to build resilient systems and streamline their response efforts. We will dive into the specific processes, roles, and tooling that transform incident response from a stressful, chaotic scramble into a predictable, controlled process. You will learn how to minimize Mean Time to Resolution (MTTR), improve service reliability, and foster a culture of blameless, continuous improvement.
Forget generic advice. This article provides a comprehensive collection of battle-tested strategies to build a robust incident management framework. We will cover everything from establishing dedicated response teams and implementing clear severity levels to creating detailed runbooks and conducting effective post-incident reviews. Each practice is broken down into actionable steps you can implement immediately. Whether you're a startup CTO building from scratch or an enterprise leader refining an existing program, these insights will help you master the art of turning incidents into opportunities for growth and resilience.
1. Establish a Dedicated Incident Response Team
A foundational best practice for incident management is moving from an ad-hoc, all-hands-on-deck approach to a structured, dedicated incident response team. This involves formally defining roles and responsibilities to ensure a swift, coordinated, and effective response when an incident occurs. Instead of scrambling to figure out who does what, a pre-defined team can immediately execute a well-rehearsed plan.

This model, popularized by Google's Site Reliability Engineering (SRE) practices and ITIL frameworks, ensures clarity and reduces mean time to resolution (MTTR). By designating specific roles, you eliminate confusion and empower individuals to act decisively.
Key Roles and Responsibilities
A robust incident response team typically includes several core roles. While the exact structure can vary, these are the most critical functions:
- Incident Commander (IC): The ultimate decision-maker and leader during an incident. The IC manages the overall response, delegates tasks, and ensures the team stays focused on resolution. They do not typically perform technical remediation themselves but instead focus on coordination, removing roadblocks, and maintaining a high-level view.
- Communications Lead: Manages all internal and external communications. This role is responsible for updating stakeholders, crafting status page updates, and preventing engineers from being distracted by communication requests. They translate technical details into business-impact language.
- Technical Lead / Subject Matter Expert (SME): The primary technical investigator responsible for diagnosing the issue, forming a hypothesis, and proposing solutions. They lead the hands-on remediation efforts, such as executing database queries, analyzing logs, or pushing a hotfix.
- Scribe: Documents the entire incident timeline, key decisions, actions taken, and observations in a dedicated channel (e.g., a Slack channel). This log is invaluable for post-incident reviews, capturing everything from
kubectlcommands run to key metrics observed in Grafana.
Actionable Implementation Tips
To effectively establish your team, consider these steps:
- Document and Define Roles: Create clear, accessible documentation in a Git-based wiki for each role's responsibilities and handoff procedures. Define explicit hand-offs, such as "The IC hands over coordination to the incoming IC by providing a 5-minute summary of the incident state."
- Implement On-Call Rotations: Use tools like PagerDuty or Opsgenie to manage on-call schedules with clear escalation policies. Rotate roles, especially the Incident Commander, to distribute the workload and prevent burnout while broadening the team's experience.
- Conduct Regular Drills: Run quarterly incident simulations or "Game Days" to practice the response process. Use a tool like Gremlin to inject real failure (e.g., high latency on a specific API endpoint) into a staging environment and have the team respond as if it were a real incident.
- Empower the Incident Commander: Grant the IC the authority to make critical decisions without needing executive approval, such as deploying a risky fix, initiating a database failover, or spending emergency cloud budget to scale up resources. This authority should be explicitly written in your incident management policy.
2. Implement a Clear Incident Classification and Severity System
Once you have a dedicated team, the next critical step is to create a standardized framework for classifying incidents. This involves establishing clear, predefined criteria to categorize events by their severity and business impact. A well-defined system removes guesswork, ensures consistent prioritization, and dictates the appropriate level of response for every incident.
This practice, central to frameworks like ITIL and the NIST Cybersecurity Framework, ensures that a minor bug doesn't trigger a company-wide panic, while a critical outage receives immediate, high-level attention. It directly impacts resource allocation, communication protocols, and escalation paths, making it one of the most important best practices for incident management.
Key Severity Levels and Definitions
While naming conventions vary (e.g., P1-P4, Critical-Low), the underlying principle is to link technical symptoms to business impact. A typical matrix looks like this:
- SEV 1 (Critical): A catastrophic event causing a complete service outage, significant data loss, or major security breach affecting a large percentage of customers. Requires an immediate, all-hands response. Example: The primary customer-facing API returns 5xx errors for >50% of requests. Response target: <5 min acknowledgement, <1 hour resolution.
- SEV 2 (High): A major incident causing significant functional impairment or severe performance degradation for a large number of users. Core features are unusable, but workarounds may exist. Example: Customer login functionality has a p99 latency >5 seconds, or a background job processing queue is delayed by more than 1 hour. Response target: <15 min acknowledgement, <4 hours resolution.
- SEV 3 (Moderate): A minor incident affecting a limited subset of users or non-critical functionality. The system is still operational, but users experience inconvenience. Example: The "export to CSV" feature is broken on the reporting dashboard for a specific user segment. Response target: Handled during business hours.
- SEV 4 (Low): A cosmetic issue or a problem with a trivial impact on the user experience that does not affect functionality. Example: A typo in the footer of an email notification. No immediate response required; handled via standard ticketing.
Actionable Implementation Tips
To effectively implement an incident classification system, follow these steps:
- Define Impact with Business Metrics: Tie severity levels directly to Service Level Objectives (SLOs) and business KPIs. For example, a SEV-1 could be defined as "SLO for API availability drops below 99.9% for 5 minutes" or "checkout conversion rate drops by 25%."
- Create Decision Trees or Flowcharts: Develop simple, visual aids in your wiki that on-call engineers can follow to determine an incident's severity. This should be a series of yes/no questions: "Is there data loss? Y/N", "What percentage of users are affected? <1%, 1-50%, >50%".
- Integrate Severity into Alerting: Configure your monitoring and alerting tools (like Datadog or Prometheus Alertmanager) to automatically assign a tentative severity level to alerts based on predefined thresholds. Use labels in Prometheus alerts (
severity: critical) that map directly to PagerDuty priorities. - Regularly Review and Refine: Schedule quarterly reviews of your severity definitions. Analyze past incidents to see if the assigned severities were appropriate. Use your incident management tool's analytics to identify trends where incidents were frequently upgraded or downgraded and adjust criteria accordingly.
3. Create and Maintain Comprehensive Incident Runbooks
While a dedicated team provides the "who," runbooks provide the "how." One of the most critical best practices for incident management is creating and maintaining comprehensive, step-by-step guides for handling predictable failures. These runbooks, also known as playbooks, codify institutional knowledge, turning chaotic, memory-based responses into a calm, systematic process.
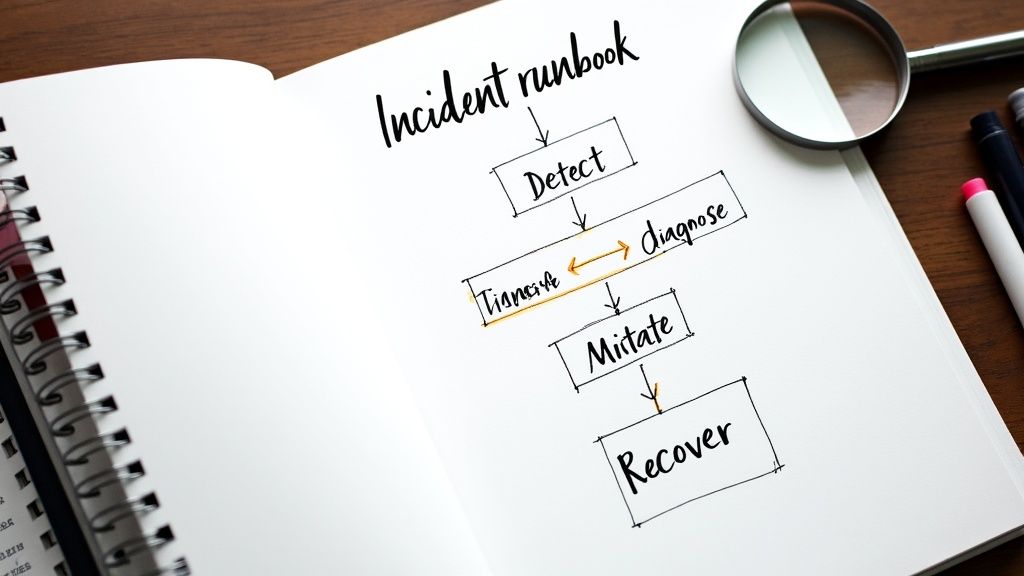
The core principle, heavily influenced by Google's SRE philosophy, is that human operators are most effective when executing a pre-approved plan rather than inventing one under pressure. Runbooks contain everything a responder needs to diagnose, mitigate, and resolve a specific incident, dramatically reducing cognitive load and shortening MTTR.
Key Components of a Runbook
An effective runbook is more than just a list of commands. It should be a complete, self-contained guide for a specific alert or failure scenario.
- Trigger Condition: Clearly defines the alert or symptom that activates this specific runbook (e.g., "Prometheus Alert
HighLatencyAuthServiceis firing"). - Diagnostic Steps: A sequence of commands and queries to confirm the issue and gather initial context. Include direct links to Grafana dashboards and specific shell commands like
kubectl logs -l app=auth-service --tail=100orgrep "ERROR" /var/log/auth-service.log. - Mitigation and Remediation: Ordered, step-by-step instructions to fix the problem, from simple actions like
kubectl rollout restart deployment/auth-serviceto more complex procedures like initiating a database failover withpg_ctl promote. - Escalation Paths: Clear instructions on who to contact if the initial steps fail and what information to provide them. Example: "If restart does not resolve the issue, escalate to the on-call database administrator with the output of the last 3 commands."
- Rollback Plan: A documented procedure to revert any changes made if the remediation actions worsen the situation, such as
helm rollback auth-service <PREVIOUS_VERSION>.
Actionable Implementation Tips
To make your runbooks a reliable asset rather than outdated documentation, follow these steps:
- Centralize and Version Control: Store runbooks in Markdown format within a Git repository alongside your application code. This treats documentation as code and allows for peer review of changes.
- Automate Where Possible: Embed scripts or use tools like Rundeck or Ansible to automate repetitive commands within a runbook. A runbook step could be "Execute the
restart-podjob in Rundeck with parameterpod_name." - Link Directly from Alerts: Configure your monitoring tools (e.g., Datadog, Prometheus) to include a direct link to the relevant runbook within the alert notification itself. In Prometheus Alertmanager, use the
annotationsfield to add arunbook_url. - Review and Update After Incidents: Make runbook updates a mandatory action item in every post-incident review. If a step was unclear, incorrect, or missing, create a pull request to update the runbook immediately.
4. Establish Clear Communication Protocols and Channels
Effective incident management hinges on communication just as much as technical remediation. Establishing clear, pre-defined communication protocols ensures that all stakeholders, from engineers to executives to end-users, receive timely and accurate information. This practice transforms chaotic, ad-hoc updates into a predictable, confidence-building process, which is a core tenet of modern incident management best practices.
This approach, championed by crisis communication experts and integrated into ITIL frameworks, prevents misinformation and reduces the cognitive load on the technical team. By creating dedicated channels and templates, you streamline the flow of information, allowing engineers to focus on the fix while a dedicated lead handles updates. Companies like Stripe and AWS demonstrate mastery here, using transparent, regular updates during outages to maintain customer trust.
Key Communication Components
A comprehensive communication strategy addresses distinct audiences through specific channels and message types. The goal is to deliver the right information to the right people at the right time.
- Internal Technical Channel: A real-time "war room" (e.g., a dedicated Slack or Microsoft Teams channel, like
#incident-2025-05-21-api-outage). This is for technical-heavy, unfiltered communication, log snippets, and metric graphs. - Internal Stakeholder Updates: Summarized, non-technical updates for internal leaders and business stakeholders in a channel like
#incidents-stakeholders. These focus on business impact, customer sentiment, and the expected timeline for resolution. - External Customer Communication: Public-facing updates delivered via a status page (like Statuspage or Instatus), email, or social media. These messages are carefully crafted to be clear, empathetic, and jargon-free.
Actionable Implementation Tips
To build a robust communication protocol, implement the following steps:
- Assign a Dedicated Communications Lead: As part of your incident response team, designate a Communications Lead whose sole responsibility is managing updates. This frees the Technical Lead and Incident Commander to focus on resolution.
- Create Pre-defined Templates: Develop templates in your wiki or incident management tool for different incident stages (Investigating, Identified, Monitoring, Resolved) and for each audience. Use placeholders like
[SERVICE_NAME],[USER_IMPACT], and[NEXT_UPDATE_TIME]. - Establish a Clear Cadence: Define a standard update frequency based on severity. For a critical SEV-1 incident, a public update every 15 minutes is a good starting point, even if the update is "We are still investigating and will provide another update in 15 minutes." For SEV-2, every 30-60 minutes may suffice.
- Use Plain Language Externally: Avoid technical jargon in customer-facing communications. Instead of "a cascading failure in our Redis caching layer caused by a connection storm," say "We are experiencing intermittent errors and slow performance with our primary application. Our team is working to restore full speed."
- Automate Where Possible: Integrate your incident management tool (e.g., Incident.io) with Slack and your status page. Use slash commands like
/incident declareto automatically create channels, start a meeting, and post an initial status page update.
5. Implement Real-Time Incident Tracking and Management Tools
Manual incident tracking using spreadsheets or shared documents is a recipe for chaos. A modern best practice for incident management involves adopting specialized software platforms designed to track, manage, and collaborate on incidents from detection to resolution. These tools act as a centralized command center, providing a single source of truth for all incident-related activities.

Pioneered by DevOps and SRE communities, platforms like PagerDuty, Opsgenie, and Incident.io automate workflows, centralize communications, and generate crucial data for post-mortems. This approach drastically reduces manual overhead and ensures that no detail is lost during a high-stress event, which is vital for maintaining low MTTR.
Key Features of Incident Management Platforms
Effective incident management tools are more than just alerting systems. They offer a suite of integrated features to streamline the entire response lifecycle:
- Alert Aggregation and Routing: Centralizes alerts from various monitoring systems (Prometheus, Datadog, Grafana) and intelligently routes them to the correct on-call engineer based on predefined schedules and escalation policies.
- Collaboration Hubs: Automatically creates dedicated communication channels (e.g., in Slack or Microsoft Teams) and a video conference bridge for each incident, bringing together the right responders and stakeholders.
- Automated Runbooks and Workflows: Allows teams to define and automate common remediation steps, such as restarting a service or rolling back a deployment, directly from the tool by integrating with APIs or CI/CD systems like Jenkins or GitHub Actions.
- Status Pages: Provides built-in functionality to communicate incident status and updates to both internal and external stakeholders, managed by the Communications Lead.
Actionable Implementation Tips
To maximize the value of your chosen platform, follow these technical steps:
- Integrate with Monitoring Systems: Connect your tool to all sources of observability data via API. You can learn more about the best infrastructure monitoring tools on opsmoon.com to ensure comprehensive alert coverage from metrics, logs, and traces.
- Automate Incident Creation: Configure rules to automatically create and declare incidents based on the severity and frequency of alerts. For example, set a rule that if 3 or more high-severity alerts for the same service fire within 5 minutes, a SEV-2 incident is automatically declared.
- Define Service Dependencies: Map your services and their dependencies within the tool's service catalog. This context helps responders quickly understand the potential blast radius of an incident. When an alert for
database-primaryfires, the tool can show thatapi-serviceandauth-servicewill be impacted. - Leverage Automation: To further speed up triaging, consider integrating a chatbot for IT support or a custom Slack bot to handle initial alert data collection (e.g., fetching pod status from Kubernetes) and user reports before escalating to a human responder.
6. Conduct Regular Post-Incident Reviews (Blameless Postmortems)
Resolving an incident is only half the battle; the real value comes from learning from it to prevent recurrence. A core tenet of effective incident management is conducting structured, blameless post-incident reviews. This practice shifts the focus from "who made a mistake?" to "what in our system or process allowed this to happen?" creating a culture of psychological safety and continuous improvement.
Pioneered by organizations like Google and Etsy, this blameless approach encourages honest and open discussion. It acknowledges that human error is a symptom of a deeper systemic issue, not the root cause. By analyzing the contributing factors, teams can build more resilient systems and refined processes.
Key Components of a Blameless Postmortem
A successful postmortem is a fact-finding, not fault-finding, exercise. The goal is to produce a document that details the incident and generates actionable follow-up tasks to improve reliability.
- Incident Summary: A high-level overview of the incident, including the impact (e.g., "5% of users experienced 500 errors for 45 minutes"), duration, and severity. This sets the context for all stakeholders.
- Detailed Timeline: A minute-by-minute log of events, from the first alert to full resolution. This should include automated alerts, key actions taken (with exact commands), decisions made, and communication milestones. The Scribe's notes from the Slack channel are critical here.
- Root Cause Analysis (RCA): An investigation into the direct and contributing factors using a method like the "5 Whys." This goes beyond the immediate trigger (e.g., a bad deploy) to uncover underlying weaknesses (e.g., insufficient automated testing in the CI/CD pipeline).
- Action Items: A list of concrete, measurable tasks assigned to specific owners with clear deadlines, tracked as tickets in a system like Jira. These are designed to mitigate the root causes and improve future response efforts. For a deeper dive, learn more about improving your incident response on opsmoon.com.
Actionable Implementation Tips
To embed blameless postmortems into your culture, follow these practical steps:
- Schedule Promptly: Hold the postmortem for SEV-1/SEV-2 incidents within 24-48 hours of resolution. This ensures details are still fresh in the minds of all participants.
- Use a Standardized Template: Create a consistent template for all postmortem reports in your wiki or incident tool. This streamlines the process and ensures all critical areas are covered every time.
- Focus on "What" and "How," Not "Who": Frame all questions to explore systemic issues. Instead of "Why did you push that change?" ask "How could our deployment pipeline have caught this issue before it reached production?" and "What monitoring could have alerted us to this problem sooner?"
- Track Action Items Relentlessly: Store action items in a project management tool (e.g., Jira, Asana) and assign them a specific label like
postmortem-followup. Review the status of open items in subsequent meetings. Uncompleted action items are a primary cause of repeat incidents.
7. Establish Monitoring, Alerting, and Early Detection Systems
Reactive incident management is a losing game; the most effective strategy is to detect issues before they significantly impact users. This requires a robust monitoring, alerting, and early detection system. By implementing a comprehensive observability stack, teams can move from discovering incidents via customer complaints to proactively identifying anomalies and performance degradations in real-time.
This approach, championed by Google's SRE principles and modern observability platforms like Datadog and Prometheus, is a cornerstone of reliable systems. It shifts the focus from simply fixing broken things to understanding system behavior and predicting potential failures, dramatically reducing mean time to detection (MTTD).
Key Components of an Effective System
A mature monitoring system goes beyond basic CPU and memory checks. It provides a multi-layered view of system health through several key components:
- Metrics: Time-series data that provides a quantitative measure of your system's health. Focus on the four "Golden Signals": latency, traffic, errors, and saturation.
- Logs: Granular, timestamped records of events that have occurred within the system. Centralized logging (e.g., using the Elastic Stack or Loki) allows engineers to query and correlate events across different services during an investigation using a query language like LogQL.
- Traces: A detailed view of a single request's journey as it moves through all the microservices in your architecture, implemented using standards like OpenTelemetry. Tracing is essential for pinpointing bottlenecks and errors in distributed systems.
- Alerting Rules: Pre-defined thresholds and conditions that trigger notifications when a metric deviates from its expected range. Good alerting is high-signal and low-noise, often based on SLOs (e.g., "alert when the 5-minute error rate exceeds our 30-day error budget burn rate").
Actionable Implementation Tips
To build a system that detects incidents early, focus on these practical steps:
- Instrument Everything: Use tools like Prometheus, Datadog, or New Relic to collect metrics, logs, and traces from every layer of your stack. Use service meshes like Istio or Linkerd to automatically gather application-level metrics without code changes.
- Implement Tiered Alerting: Create different severity levels for alerts in your Alertmanager configuration (e.g.,
severity: pagefor critical,severity: ticketfor warning). Apagealert should bypass notification silencing and trigger an immediate on-call notification, while aticketalert might just create a Jira ticket. - Correlate Alerts to Reduce Noise: Use modern monitoring platforms to group related alerts into a single notification. In Prometheus Alertmanager, use
group_byrules to bundle alerts from multiple pods in the same deployment into one notification. - Connect Alerts to Runbooks: Every alert should be actionable. In the alert definition, include an annotation that links directly to the corresponding runbook URL. This empowers the on-call engineer to act quickly and correctly. For a deeper understanding of this proactive approach, learn more about what continuous monitoring is.
8. Implement On-Call Scheduling and Escalation Procedures
A critical best practice for incident management is to formalize how your team provides 24/7 coverage. Implementing structured on-call scheduling and clear escalation procedures ensures that the right person is always available and alerted when an incident occurs, preventing response delays and protecting service availability outside of standard business hours. This moves beyond relying on a few heroic individuals and establishes a sustainable, predictable system.
This approach, championed by the Google SRE model and central to DevOps culture, is about creating a fair, automated, and effective system for after-hours support. It ensures that incidents are addressed swiftly without leading to engineer burnout, a common pitfall in high-availability environments.
Key Components of an Effective On-Call System
A well-designed on-call program is more than just a schedule; it’s a complete support system. The core components work together to ensure reliability and sustainability.
- Primary Responder: The first individual alerted for a given service or system. They are responsible for initial triage, assessment, and, if possible, remediation.
- Secondary Responder (Escalation): A backup individual who is automatically alerted if the primary responder does not acknowledge an alert within a predefined timeframe (e.g., 5 minutes for a critical alert).
- Tertiary Escalation Path: A defined path to a Subject Matter Expert (SME), team lead, or engineering manager if both primary and secondary responders are unavailable or unable to resolve the issue within a specified time (e.g., 30 minutes).
- Handoff Procedure: A documented process for transferring on-call responsibility at the end of a shift, including a summary of ongoing issues, recent alerts, and system state. This can be a brief, 15-minute scheduled meeting or a detailed Slack post.
Actionable Implementation Tips
To build a robust and humane on-call system, follow these technical steps:
- Automate Schedules with Tooling: Use platforms like PagerDuty, Opsgenie, or Splunk On-Call to manage rotations, escalations, and alerting rules. This automation removes manual overhead and ensures reliability.
- Define Clear Escalation Policies: Document specific time-based rules for escalation in your tool. For example, a P1 alert policy might be: "Page Primary Responder. If no ACK in 5 min, page Primary again and Secondary. If no ACK in 10 min, page Engineering Manager."
- Keep On-Call Shifts Manageable: Limit on-call shifts to reasonable lengths, such as one week per rotation, and ensure engineers have adequate time off between their shifts to prevent burnout. Aim for a team size of at least 5-6 engineers per on-call rotation.
- Protect Responders from Alert Fatigue: Aggressively tune monitoring to reduce false positives. A noisy system erodes trust and causes engineers to ignore legitimate alerts. Implement alert throttling and deduplication in your monitoring tools and set a team-level objective to reduce actionable alerts to fewer than 2 per on-call shift.
- Compensate and Recognize On-Call Work: Acknowledge the disruption of on-call duties through compensation, extra time off, or other benefits. This recognizes the value of this critical work and aids retention.
9. Create Incident Prevention and Capacity Planning Programs
The most effective incident management strategy is to prevent incidents from happening in the first place. This requires a cultural shift from a purely reactive model to a proactive one focused on system resilience and reliability. By establishing formal programs for incident prevention and capacity planning, organizations can identify and mitigate risks before they escalate into service-disrupting events.
This approach, championed by tech giants like Netflix and Google, treats reliability as a core feature of the product. It involves systematically testing system weaknesses, planning for future growth, and embedding reliability into the development lifecycle. Proactive prevention reduces costly downtime and frees up engineering teams to focus on innovation rather than firefighting.
Key Prevention and Planning Strategies
A comprehensive prevention program incorporates several key disciplines. These strategies work together to build a more robust and predictable system:
- Chaos Engineering: The practice of intentionally injecting failures into a system to test its resilience. Tools like Netflix's Chaos Monkey or Gremlin can randomly terminate instances in production to ensure services can withstand such failures without impacting users.
- Capacity Planning: Regularly analyzing usage trends and system performance data (CPU, memory, disk I/O) to forecast future resource needs. This prevents performance degradation and outages caused by unexpected traffic spikes or organic growth.
- Architectural Reviews: Proactively assessing system designs for single points of failure, scalability bottlenecks, and resilience gaps. This is often done before new services are deployed using a formal "Production Readiness Review" (PRR) process.
- Systematic Code and Change Management: Implementing rigorous CI/CD pipelines with automated testing (unit, integration, end-to-end) and gradual rollout strategies (like canary releases or blue-green deployments) to minimize the risk of introducing bugs or misconfigurations into production.
Actionable Implementation Tips
To build a proactive prevention culture, consider these practical steps:
- Implement Chaos Engineering Drills: Start small by running controlled failure injection tests in a staging environment. Use tools like Gremlin or the open-source Chaos Toolkit to automate experiments like "blackhole traffic to the primary database" and validate that your failover mechanisms work as expected.
- Conduct Quarterly Capacity Reviews: Schedule regular meetings with engineering and product teams to review performance metrics from your monitoring system. Use forecasting models to project future demand based on the product roadmap and provision resources ahead of need.
- Use Post-Mortems to Drive Improvements: Ensure that every post-incident review generates actionable items specifically aimed at architectural or process improvements to prevent a recurrence. Prioritize these tickets with the same importance as feature work.
- Automate Pre-Deployment Checks: Integrate static analysis tools (SonarQube), security scanners (Snyk), and performance tests (k6, JMeter) directly into your CI/CD pipeline. Implement quality gates that block a deployment if it fails these automated checks.
10. Build and Maintain Incident Documentation and Knowledge Base
One of the most critical yet often overlooked best practices for incident management is creating and maintaining a centralized knowledge base. This involves systematically documenting incident histories, root causes, remediation steps, and institutional knowledge. An effective knowledge base transforms reactive fixes into proactive institutional memory, preventing repeat failures and accelerating future resolutions.
This practice, central to ITIL's knowledge management framework and Google's SRE culture, ensures that valuable lessons learned from an incident are not lost. Instead, they become a searchable, accessible resource that empowers engineers to solve similar problems faster and more efficiently, directly reducing MTTR over time.
Key Components of Incident Documentation
A comprehensive incident knowledge base should be more than a simple log. It needs to contain structured, actionable information that provides context and guidance.
- Incident Postmortems: Detailed, blameless reviews of what happened, the impact, actions taken, root cause analysis, and a list of follow-up action items to prevent recurrence.
- Runbooks and Playbooks: Step-by-step guides for diagnosing and resolving common alerts or incident types. These should be living documents, version-controlled in Git, and updated after every relevant incident.
- System Architecture Diagrams: Up-to-date diagrams of your services, dependencies, and infrastructure, ideally generated automatically using tools like
infrastructure-as-codevisualization. - Incident Timeline: A detailed, timestamped log of events, decisions, and actions taken during the incident, exported directly from the incident management tool or Slack channel.
Actionable Implementation Tips
To turn documentation from a chore into a strategic asset, implement these practical steps:
- Standardize with Templates: Create consistent Markdown templates for postmortems and runbooks and store them in a shared Git repository. Use a linter to enforce template compliance in your CI pipeline.
- Tag and Categorize Everything: Implement a robust tagging system in your documentation platform (e.g., Confluence, Notion). Tag incidents by affected service (
service:api), technology (tech:kubernetes,tech:postgres), incident type (type:latency), and root cause (root_cause:bad_deploy) for powerful searching and pattern analysis. - Link Related Incidents: When a new incident occurs, search the knowledge base for past, similar events and link to them in the new incident's ticket or channel. This helps teams quickly identify recurring patterns or systemic weaknesses that need to be addressed.
- Make Documentation a Living Resource: Treat your knowledge base as code. To maintain a dynamic and up-to-date knowledge base, consider leveraging advanced tools like an AI Documentation Agent to help automate updates, summarize incident reports, and ensure accuracy.
10-Point Incident Management Best Practices Comparison
| Item | Implementation complexity | Resource requirements | Expected outcomes | Ideal use cases | Key advantages |
|---|---|---|---|---|---|
| Establish a Dedicated Incident Response Team | High — organizational changes and role definitions | Dedicated staff, training budget, on-call schedules | Faster response, clear ownership, coordinated actions | Mid-large orgs or complex platforms with frequent incidents | Reduced confusion; faster decisions; cross-functional coordination |
| Implement a Clear Incident Classification and Severity System | Medium — define criteria, SLAs and escalation flows | Stakeholder time, documentation, integration with alerts | Consistent prioritization and timely escalation | Multi-team environments needing uniform prioritization | Ensures critical issues prioritized; reduces over-escalation |
| Create and Maintain Comprehensive Incident Runbooks | Medium–High — detailed authoring and upkeep | SME time, documentation platform, version control | Lower MTTR, repeatable remediation, junior enablement | Teams facing recurring incident types or heavy on-call use | Fast, consistent responses; reduces reliance on experts |
| Establish Clear Communication Protocols and Channels | Medium — templates, roles and cadence design | Communications lead, messaging tools, templates | Transparent stakeholder updates; reduced customer confusion | Customer-facing incidents, executive reporting, PR-sensitive events | Prevents silos; maintains trust; reduces support load |
| Implement Real-Time Incident Tracking and Management Tools | Medium–High — tool selection, integrations and rollout | Licensing, integration effort, training, ongoing maintenance | Single source of truth, audit trails, incident analytics | Distributed teams, compliance needs, complex incident workflows | Centralized info; automation; historical analysis |
| Conduct Regular Post-Incident Reviews (Blameless Postmortems) | Low–Medium — process adoption and cultural change | Time for meetings, documentation, follow-up tracking | Root-cause identification and continuous improvements | Organizations aiming for learning culture and reduced recurrence | Identifies systemic fixes; builds organizational learning |
| Establish Monitoring, Alerting, and Early Detection Systems | High — architecture, rule tuning and ML/alerts | Monitoring tools, engineers, storage, tuning effort | Faster detection, fewer customer impacts, data-driven ops | High-availability services and large-scale systems | Proactive detection; reduced MTTD; prevention of incidents |
| Implement On-Call Scheduling and Escalation Procedures | Medium — policy design and fair rotations | Staffing, scheduling tools, compensation and relief plans | 24/7 response capability and clear accountability | Services requiring continuous coverage or global support | Ensures availability; fair load distribution; rapid escalation |
| Create Incident Prevention and Capacity Planning Programs | High — long-term processes and engineering changes | Engineering time, testing tools (chaos), planning resources | Fewer incidents, improved resilience and scalability | Rapidly growing systems or organizations investing in reliability | Reduces incident frequency; long-term cost and reliability gains |
| Build and Maintain Incident Documentation and Knowledge Base | Medium — platform, templates and governance | Documentation effort, maintenance, searchable tools | Faster resolution of repeat issues; preserved institutional knowledge | Teams with turnover or complex historical incidents | Accelerates response; supports onboarding; enables trend analysis |
Achieving Elite Performance Through Proactive Incident Management
Mastering incident management is not a one-time project but a continuous journey of cultural and technical refinement. Throughout this guide, we've deconstructed the essential components of a world-class response framework. We explored how a dedicated Incident Response Team, equipped with clear roles and responsibilities, forms the backbone of any effective strategy. By implementing a standardized incident classification and severity system, you remove ambiguity and ensure that the response effort always matches the impact.
The journey from reactive firefighting to proactive resilience is paved with documentation and process. Comprehensive incident runbooks transform chaotic situations into structured, repeatable actions, drastically reducing cognitive load under pressure. Paired with clear communication protocols and dedicated channels, they ensure stakeholders are informed, engineers are focused, and resolutions are swift. These processes are not just about managing the present moment; they are about building a more predictable and stable future.
From Reactive to Proactive: A Cultural and Technical Shift
The true evolution in incident management occurs when an organization moves beyond simply resolving issues. Implementing the best practices for incident management we've discussed catalyzes a fundamental shift. It's about instrumenting your systems with robust monitoring and alerting to detect anomalies before they cascade into user-facing failures. It's about establishing fair, sustainable on-call schedules and logical escalation procedures that prevent burnout and ensure the right expert is always available.
Perhaps the most critical element in this transformation is the blameless post-mortem. By dissecting incidents without fear of reprisal, you uncover systemic weaknesses and foster a culture of collective ownership and continuous learning. This learning directly fuels your incident prevention and capacity planning programs, allowing your team to engineer out entire classes of future problems. Ultimately, every incident, every runbook, and every post-mortem contributes to a living, breathing knowledge base that accelerates onboarding, standardizes responses, and compounds your team’s institutional wisdom over time.
Your Roadmap to Operational Excellence
Adopting these practices is an investment in your product's stability, your customers' trust, and your engineers' well-being. The goal is to create an environment where incidents are rare, contained, and valuable learning opportunities rather than sources of stress and churn. While the path requires commitment and discipline, the rewards are immense: significantly lower Mean Time to Resolution (MTTR), higher system availability, and a more resilient, confident engineering culture.
This framework is not a rigid prescription but a flexible roadmap. Start by assessing your current maturity level against these ten pillars. Identify your most significant pain points, whether it's chaotic communication, inadequate tooling, or a lack of post-incident follow-through. Select one or two areas to focus on first, implement the recommended changes, and measure the impact. By iterating on this cycle, you will steadily build the processes, tools, and culture needed to achieve elite operational performance.
Ready to accelerate your journey to reliability? OpsMoon provides on-demand access to elite DevOps, SRE, and Platform Engineering experts who specialize in implementing these best practices for incident management. Let our top-tier engineers help you assess your current processes, implement the right tooling, and build the robust infrastructure needed to achieve operational excellence. Start with a free work planning session to map out your roadmap to a more reliable future.