What is Chaos Engineering? A Technical Guide to Building Resilient Systems
 By opsmoon
Learn what is chaos engineering, how it helps build resilient systems, and discover best practices to design effective controlled experiments.
Chaos engineering isn't about creating chaos. It’s the exact opposite. It's the disciplined, experimental practice of injecting precise, controlled failures into a system to expose latent weaknesses before they manifest as production catastrophes.
Think of it like a vaccine for your software stack. You introduce a controlled stressor to build systemic immunity against real-world failures, preventing costly downtime and SLO breaches.
Uncovering System Weaknesses Before They Strike
At its core, chaos engineering is a proactive discipline. Instead of waiting for a PagerDuty alert at 3 a.m., you intentionally stress your system in a controlled environment to validate its behavior under turbulent conditions. This is how you discover hidden dependencies, misconfigured timeouts, flawed retry logic, and incorrect assumptions about inter-service communication.
The goal is simple: gain empirical confidence that your distributed system can handle the unpredictable conditions of a production environment. It’s a fundamental shift from the reactive "break-fix" cycle to a proactive "break-to-fix" mindset.
The Business Case for Controlled Chaos
Why intentionally break production-like systems? The rationale is rooted in business continuity and financial risk mitigation. System downtime is brutally expensive. Recent research shows that for 98% of organizations, just a single hour of downtime costs over $100,000. For large enterprises, these figures escalate dramatically. British Airways, for example, suffered an estimated £80 million (~$102 million USD) loss from one major outage.
By systematically injecting faults, engineering teams can find and remediate vulnerabilities before they become headline-making outages that crater revenue and erode customer trust.
This proactive approach is non-negotiable in today's complex tech stacks:
- Microservices Architectures: In a distributed system with hundreds of services, a single misconfigured timeout or resource limit can trigger a cascading failure that is impossible to predict through static analysis or unit testing.
- Cloud-Native Infrastructure: The dynamic, ephemeral nature of cloud platforms like AWS, GCP, and Azure introduces failure modes—such as instance termination, network partitions, and API rate limiting—that traditional testing methodologies were not designed to handle.
- Customer Expectations: Users today expect 24/7 availability. Any perceptible disruption can directly impact churn and customer lifetime value.
More Than Just Testing
It’s easy to confuse chaos engineering with simple fault injection, but it's a much deeper discipline. It’s an experimental methodology rooted in scientific principles, sharing significant DNA with Site Reliability Engineering (SRE). While it complements robust risk management frameworks, its unique value is in empirically validating their effectiveness against real-world, unpredictable scenarios.
To understand the difference, let's compare chaos engineering with traditional testing methods from a technical standpoint.
Chaos Engineering vs Traditional Testing
This table contrasts the proactive, experimental approach of chaos engineering with conventional testing methods, highlighting its unique value in complex systems.
| Concept | Chaos Engineering Approach | Traditional Testing Approach |
|---|---|---|
| Primary Goal | Build confidence in system resilience under unpredictable, real-world conditions. | Verify that a component meets known, predefined functional requirements. |
| Environment | Production or a high-fidelity staging environment with real traffic patterns. | Isolated test or QA environments, often with mocked dependencies. |
| Methodology | Experimental; forms a hypothesis, injects a real-world failure (e.g., packet loss), and measures the systemic impact. | Scripted; follows predefined test cases with binary pass/fail outcomes. |
| Scope | Focuses on the emergent properties and unknown-unknowns of the entire distributed system. | Focuses on specific functions, features, or components in isolation (unit, integration tests). |
| Mindset | "What happens if this dependency experiences 300ms of latency?" (Proactive exploration) | "Does this function return the expected value for a given input?" (Reactive validation) |
As you can see, chaos engineering isn’t just about checking boxes; it's about asking tougher questions and preparing for the unknown.
The core practice follows a simple scientific method:
- Establish a Baseline: Quantify the system's normal behavior through key performance indicators (KPIs) and service-level objectives (SLOs) to define a "steady state."
- Form a Hypothesis: State a falsifiable prediction about how the system will behave during a specific failure scenario.
- Inject a Fault: Introduce a precise, controlled variable, such as network latency or CPU pressure.
- Observe and Verify: Measure the deviation from the steady-state baseline and compare it against the hypothesis.
Chaos engineering is the discipline of experimenting on a system in order to build confidence in the system's capability to withstand turbulent conditions in production.
The real engineering value is derived from analyzing the delta between your expectations and the observed reality. This process leads to more resilient, predictable, and reliable software, empowering engineering teams with a deep, intuitive understanding of the complex distributed systems they build and maintain.
The Netflix Origin Story of Chaos Engineering
To truly grasp chaos engineering, you must understand its origins. This isn't just a history lesson; it's a technical case study in survival, born from a catastrophic failure that forced a paradigm shift in software architecture and reliability.
The story begins in 2008 when a massive database corruption brought Netflix's entire DVD shipping operation to a halt for three full days. This painful, high-profile outage was a wake-up call. The engineering team realized that designing systems for perfect, ideal conditions was a losing strategy. They had to design systems that could fail—and fail gracefully.
From Monolith to Microservices in the Cloud
This new philosophy became a mandate when Netflix began its migration from on-premise data centers to the public cloud with Amazon Web Services (AWS) around 2010. Moving to a distributed, cloud-native architecture solved many single-point-of-failure problems but introduced a new universe of potential failure modes. EC2 instances could terminate without warning, network latency could spike unpredictably, and entire availability zones could become unreachable.
How could you guarantee a smooth streaming experience when any piece of your infrastructure could vanish at any moment? The only path forward was to embrace failure proactively.
This mindset shift was the genesis of chaos engineering. Instead of waiting for infrastructure to fail, Netflix engineers began to terminate it on purpose, in a controlled manner, to expose weaknesses before they caused customer-facing outages.
The Birth of Chaos Monkey and the Simian Army
This new approach led to the creation of their first chaos engineering tool in 2011: Chaos Monkey. Its function was brutally simple but incredibly effective: run in the production environment and randomly terminate EC2 instances. If a service went down because Chaos Monkey killed one of its instances, that service was, by definition, not resilient. This forced every engineering team to build redundancy and fault tolerance directly into their applications from day one.
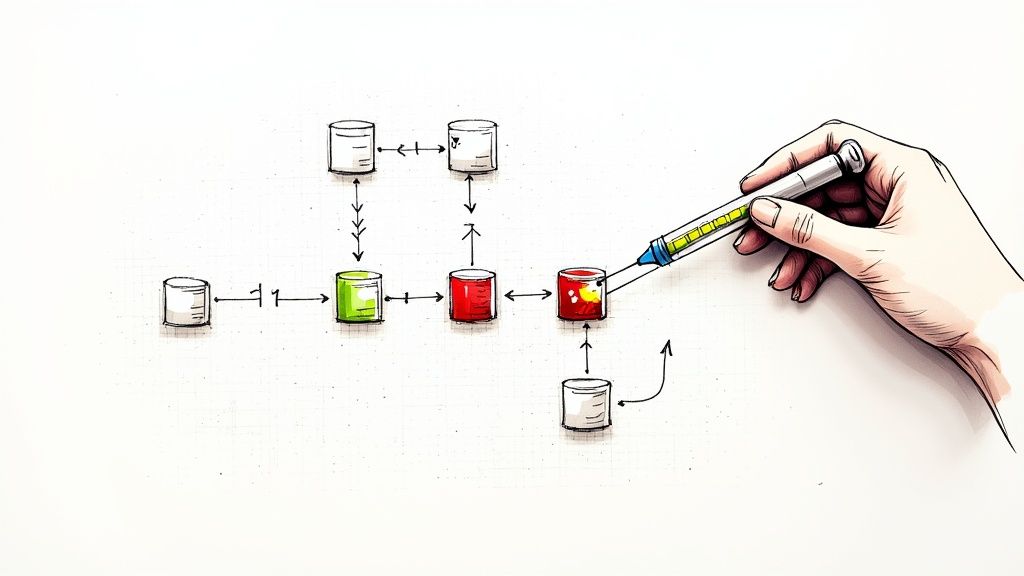
The diagram below illustrates the fundamental feedback loop of a Chaos Monkey-style experiment. A fault is intentionally injected to validate the system's resilience mechanisms.

This loop—defining a steady state, injecting a fault, and analyzing the system's response—is the scientific method at the heart of the entire discipline.
Chaos Monkey's success led to a whole suite of tools known as the Simian Army, each designed to simulate a different class of real-world failure:
- Latency Monkey introduced artificial network delays to test service timeouts and retry logic.
- Janitor Monkey identified and removed unused cloud resources to prevent resource leakage and configuration drift.
- Chaos Gorilla elevated the scale by simulating the failure of an entire AWS Availability Zone.
This evolution from a single, targeted tool to a formal engineering practice is what established chaos engineering as a critical discipline. For a deeper dive, you can explore the full timeline and technical evolution by reviewing the history of chaos testing on aqua-cloud.io. Netflix didn't just build a tool; they pioneered a culture of resilience that has fundamentally changed how modern software is architected and validated.
Mastering the Principles of Chaos Engineering
Chaos engineering is not about pulling random levers to see what sparks. It's a disciplined, scientific practice for discovering latent faults in your system before they trigger a catastrophic failure.
The discipline is built on four core principles that form the scientific method for system reliability. Adhering to them is what separates chaos engineering from simply causing chaos. This structure transforms the vague idea of "testing for failure" into a concrete engineering workflow that quantifiably builds confidence in your system's resilience.
This diagram illustrates the complete experimental loop. You begin by quantifying your system's "steady state," then introduce a controlled variable, and finally, measure the deviation to validate its resilience.
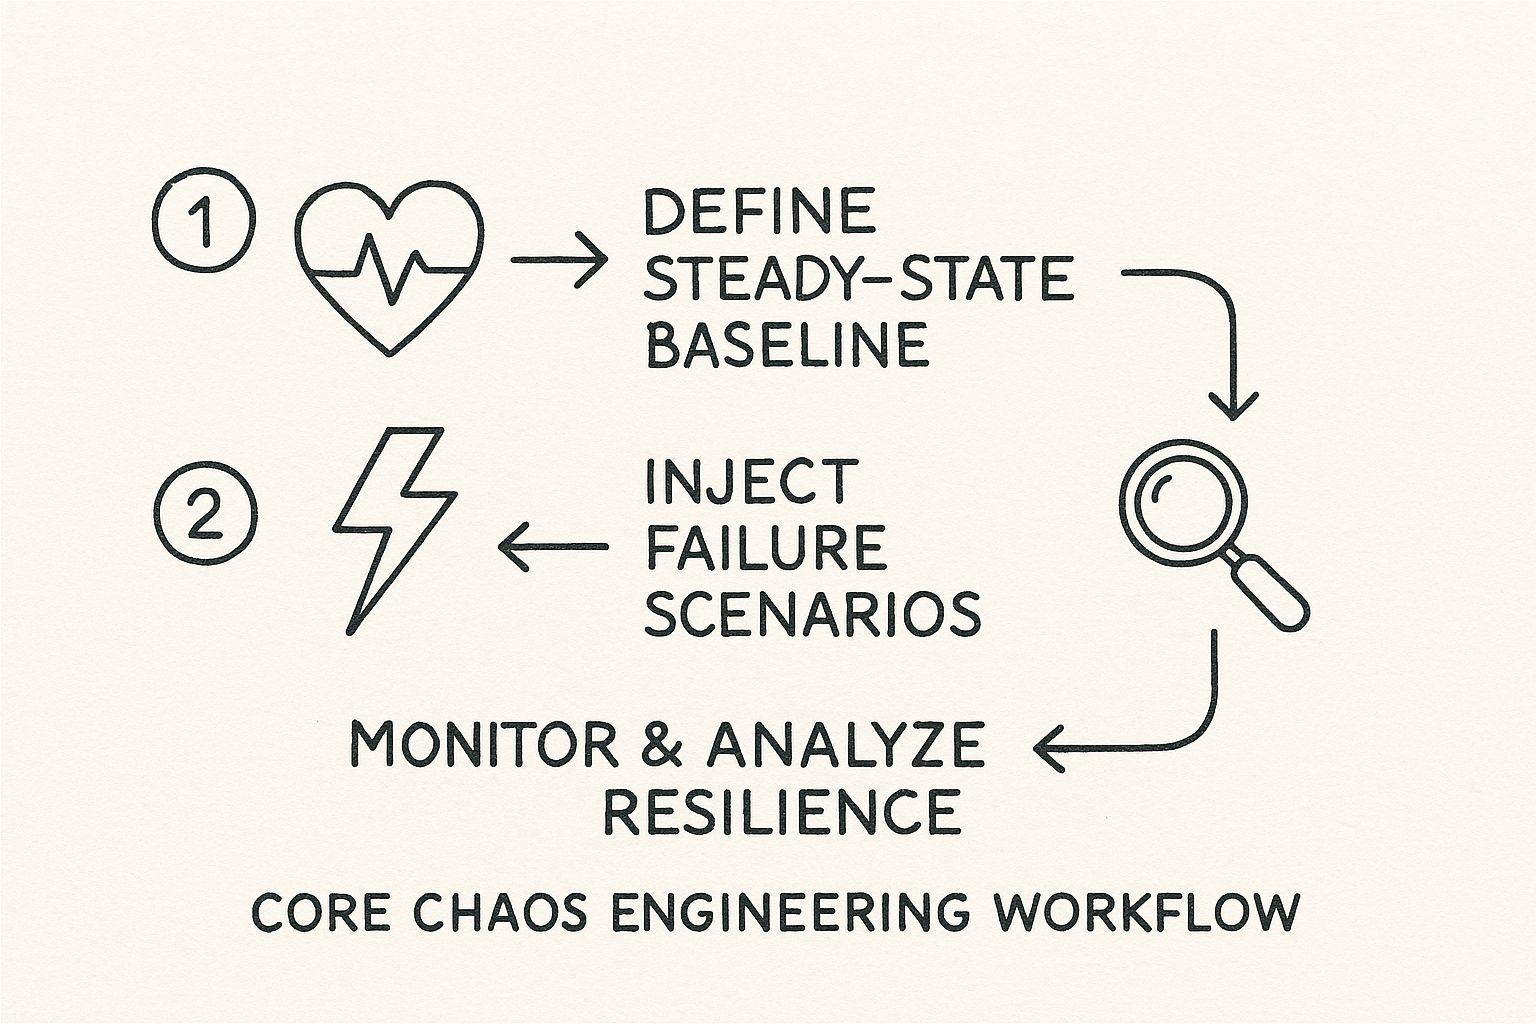
It is a continuous feedback cycle: define normal, create a disruption, measure the impact, and use the findings to harden the system. Then, repeat.
Step 1: Define Your System's Steady State
Before you can introduce chaos, you must quantify "calm." This is your steady state—a measurable, data-driven baseline of your system's behavior under normal conditions. This is not a subjective assessment; it's a collection of technical and business metrics that represent system health.
Defining this steady state requires a holistic view that directly correlates system health with user experience.
- System-Level Metrics: These are the fundamental health indicators. Think p99 request latency, error rates (e.g., HTTP 5xx), queue depths, or resource utilization (CPU, memory). In a Kubernetes environment, this could include pod restart counts or CPU throttling events.
- Business-Level Metrics: These are the key performance indicators (KPIs) that directly reflect business value. Examples include transactions completed per minute, successful user logins per second, or items added to a shopping cart. A deviation in these metrics is a direct indicator of customer impact.
A robust steady state is represented by a collection of these metrics, typically visualized on an observability dashboard. This dashboard becomes your source of truth for the experiment.
Step 2: Formulate a Hypothesis
With your steady state defined, you must formulate an educated, falsifiable prediction. This is the "science" in the scientific method. You are not injecting faults randomly; you are forming a specific, testable hypothesis about how your system should handle a specific failure mode.
A strong hypothesis is always an assertion of resilience. It is a confident statement that the system will maintain its steady state despite the introduction of a controlled fault.
A Real-World Hypothesis: "If we inject 300ms of network latency between the
checkout-serviceand thepayment-gateway, the p99 latency for API requests will remain below 500ms, and the transaction success rate will not deviate by more than 1% from the baseline. We believe this because the service's retry logic and connection pool timeouts are configured to handle this level of degradation."
This hypothesis is powerful because it is precise. It specifies the target, the fault type and magnitude, and the exact, measurable outcome you expect.
Step 3: Inject Realistic Failures
Now, you intentionally introduce a failure. The key is to do this in a controlled, precise manner that simulates a real-world problem. You are mimicking the kinds of infrastructure, network, and application-level failures that occur in production.
Common fault injection types include:
- Resource Exhaustion: Injecting CPU or memory pressure to validate auto-scaling policies and resource limits.
- Network Partitioning: Using iptables or eBPF to drop packets between services to test timeout configurations and fallback mechanisms.
- Latency Injection: Intentionally delaying network packets to verify how services react to dependency degradation.
- Instance Termination: Killing pods, containers, or virtual machines to validate self-healing and failover mechanisms.
The goal is to build confidence by methodically probing for weaknesses within a controlled experiment. Observing the system's response to stress allows you to quantify recovery times and validate its resilience. This methodical approach is crucial for modern distributed systems, and you can learn more about these operational readiness metrics on Wikipedia.
Step 4: Analyze the Results and Try to Disprove the Hypothesis
The final step is the moment of truth. You compare the observed outcome to your hypothesis. Did the system maintain its steady state as predicted? Especially in early experiments, the answer will likely be no. This is the desired outcome, as it represents a learning opportunity.
If your hypothesis is disproven—for instance, the injected latency caused a cascading failure that your retry logic missed, leading to a 10% drop in transactions—you have discovered a latent vulnerability before it impacted customers. The delta between expectation and reality is an invaluable engineering insight.
This is not a failure; it is a discovery. The analysis provides a clear, data-driven mandate to remediate the weakness, making the system more robust and truly resilient.
Your Technical Toolkit for Chaos Engineering
Theory and principles are insufficient for execution. To run chaos engineering experiments, you need a toolkit. The landscape offers a range of options, from open-source projects to enterprise-grade commercial platforms. Selecting the appropriate tool for your technology stack is the first step toward conducting meaningful experiments.
The right tool provides a control plane for injecting precise, controlled failures while incorporating safety mechanisms to contain the "blast radius" of the experiment.
Open-Source Tools for Kubernetes-Native Chaos
For teams standardized on Kubernetes, several Cloud Native Computing Foundation (CNCF) projects have emerged as industry standards. These tools are "Kubernetes-native," meaning they leverage Custom Resource Definitions (CRDs). This allows you to define and manage experiments declaratively using YAML, integrating seamlessly with existing GitOps workflows.
Chaos Mesh is a CNCF incubating project known for its comprehensive fault injection capabilities. Experiments are defined via simple YAML manifests, making it a natural fit for infrastructure-as-code practices.
For example, to validate a deployment's self-healing capabilities, a Chaos Mesh experiment is just a few lines of YAML:
apiVersion: chaos-mesh.org/v1alpha1
kind: PodChaos
metadata:
  name: pod-failure-example
  namespace: my-app
spec:
  action: pod-failure
  mode: one
  duration: '60s'
  selector:
    labelSelectors:
      app: critical-service
This manifest instructs Chaos Mesh to randomly terminate one pod with the label app: critical-service for a duration of 60 seconds. It's a quick, effective way to confirm that your deployment’s readiness probes and replica set controller are configured correctly.
Another powerful option is LitmusChaos. Also a CNCF project, Litmus provides a large marketplace of pre-defined chaos experiments called the "ChaosHub." This accelerates adoption by providing ready-to-use templates for common scenarios like resource exhaustion, network latency, and pod deletion.
Commercial Platforms for Enterprise-Grade Safety
While open-source tools are powerful, commercial platforms like Gremlin add layers of safety, automation, and governance that enterprises require. Gremlin offers a polished UI, detailed reporting, and advanced safety features that help organizations scale their chaos engineering practice without risking accidental production outages.
Commercial platforms typically excel with features like:
- Automated Blast Radius Containment: These tools automatically limit an experiment's scope to a specific number of hosts or a percentage of traffic, preventing a test from escalating.
- GameDay Automation: They provide workflows for orchestrating "GameDays"—planned events where teams collaborate on a series of chaos experiments to validate end-to-end system resilience.
- Enterprise Safety Controls: An automated shutdown mechanism (the "dead man's switch") will halt an experiment immediately if it breaches predefined SLOs or negatively impacts key business metrics.
The primary value of these platforms is their intense focus on safety and control. They provide the guardrails necessary to run experiments in production with high confidence, ensuring you are learning from controlled failures, not causing them.
Of course, injecting faults is only half the process. You must observe the impact, which requires a robust observability stack. By integrating your chaos experiments with the best infrastructure monitoring tools, you can directly correlate an injected fault with changes in performance, error rates, and user experience. This provides a complete, data-driven picture of the system's response.
A Technical Comparison of Chaos Engineering Tools
Choosing a tool depends on your team’s maturity, target environment, and objectives. This table breaks down some key technical differences to guide your decision.
| Tool | Type | Primary Target Environment | Key Technical Features |
|---|---|---|---|
| Chaos Mesh | Open-Source (CNCF) | Kubernetes | Declarative YAML experiments via CRDs, broad fault types (network, pod, I/O), visual dashboard. |
| LitmusChaos | Open-Source (CNCF) | Kubernetes | Extensive ChaosHub of pre-built experiments, GitOps-friendly, workflow-based experiment chaining. |
| Gremlin | Commercial | Cloud (VMs, Kubernetes), On-Prem | UI-driven and API-driven experiments, automated safety controls, GameDay scenarios, detailed reporting. |
Ultimately, the goal is to select a tool that empowers your team to begin experimenting safely. Whether you start with a simple pod-kill experiment using Chaos Mesh in staging or run a full-scale GameDay with Gremlin in production, the right toolkit is essential for putting chaos engineering theory into practice.
How to Run Your First Experiment Safely
Transitioning from chaos engineering theory to practice can be daunting. A foundational rule mitigates the risk: start small, start safely, and minimize the blast radius.
Your first experiment is not intended to trigger a major outage. The objective is to build confidence in the process, validate your observability tooling, and establish a repeatable methodology for discovering and remediating weaknesses.
The ideal starting point is a non-production environment, such as staging or development, that closely mirrors your production stack. This provides a safe sandbox to execute the entire experimental loop without any risk to real users.
Let's walk through a concrete playbook for testing how a microservice handles database latency.
Step 1: Select a Simple, Non-Critical Service
For your initial experiment, select a low-risk, well-understood target. Avoid critical, user-facing components or complex systems with unknown dependencies.
A suitable candidate might be an internal-facing API, a background job processor, or a non-essential service. For this example, we'll target the user-profile-service. It is important but not on the critical path for core business transactions, making it an ideal first target.
Step 2: Define Its Steady-State Behavior
Before injecting any fault, you must quantify "normal." This is your steady-state—a set of quantitative metrics that define the service's health, ideally aligned with your Service Level Objectives (SLOs).
For our user-profile-service, the steady-state might be:
- p99 Latency: The 99th percentile of API response times remains under 200ms.
- Error Rate: The rate of HTTP 5xx server errors is below 0.1%.
- Throughput: The service processes a baseline of 50 requests per second.
This observability dashboard is now your source of truth. If these metrics remain within their defined thresholds during the experiment, you have validated the system's resilience to that specific failure mode.
Step 3: Hypothesize Its Fallback Behavior
Now, formulate a clear, falsifiable hypothesis about the system's reaction to a specific failure. A good hypothesis is a precise assertion of resilience.
Hypothesis: "If we inject 300ms of latency on all outbound database connections from the
user-profile-servicefor 60 seconds, the service will handle it gracefully. We expect its p99 latency to increase but remain under 400ms, with no significant increase in the error rate, because its connection pool timeouts are configured to 500ms."
This is not a guess; it's a specific and measurable prediction. It clearly defines the fault, the target, and the expected outcome, leaving no ambiguity in the results.
Step 4: Inject Latency and Monitor the Metrics
With your hypothesis defined, execute the experiment. Using your chaos engineering tool, configure an attack to inject 300ms of network latency between the user-profile-service and its database. The experiment must be time-boxed and scoped.
Crucially, you must have automated stop conditions. These are kill switches that immediately halt the experiment if your core SLOs are breached. For example, configure the tool to abort the test if the error rate exceeds 5%, preventing unintended consequences.
Step 5: Analyze the Outcome and Remediate
Once the 60-second experiment concludes, analyze the data. Compare the observed metrics against your hypothesis. Did the p99 latency remain below 400ms? Did the error rate hold steady?
Imagine your observability platform shows that the p99 latency actually spiked to 800ms and the error rate climbed to 15%. Your hypothesis was disproven. This is a success. You have uncovered a latent vulnerability. The data indicates that the service's timeout configurations were not functioning as expected, leading to a cascading failure under moderate database degradation.
This is where the engineering value is realized. You now have empirical evidence to create an actionable ticket for the development team to adjust connection pool settings, implement a circuit breaker pattern, or improve fallback logic. Your findings directly lead to a more robust system and better incident response best practices. Discovering these issues proactively is the core purpose of chaos engineering.
Real-World Chaos Engineering Scenarios
Once you have mastered the basics, chaos engineering becomes a powerful tool for solving complex, real-world reliability challenges. This involves moving beyond single-component failures and into testing the emergent behavior of your entire distributed system under duress.
Let's review a playbook of technical scenarios. These are templates for hardening your infrastructure against common, high-impact outage patterns.
Validating Kubernetes Auto-Scaling Resilience
Kubernetes promises self-healing and auto-scaling, but are your Horizontal Pod Autoscaler (HPA) and cluster autoscaler configurations correct? Let's validate them empirically.
-
Problem Statement: An unexpected node failure terminates multiple pods in a critical microservice. Can the Kubernetes control plane react quickly enough to reschedule pods and scale up to handle the load without dropping user requests?
-
Experiment Design: Use a chaos engineering tool to execute a Pod Failure experiment. Terminate 50% of the pods in a target deployment for five minutes.
-
Expected Outcome: Your observability dashboards should show the HPA detecting the pod loss and scaling the deployment back to its desired replica count. Crucially, your user-facing metrics (p99 latency, error rate) should remain within their SLOs. If so, you have proven the system can absorb significant infrastructure failure without customer impact.
This experiment is invaluable for validating that your pod resource requests and limits are correctly configured and that your application can handle the "thundering herd" of traffic that is redistributed to remaining pods while new ones are being provisioned.
Uncovering a cascading failure during a controlled experiment is infinitely preferable to discovering it at 2 AM during a peak traffic event. These scenarios are designed to expose hidden dependencies that only surface under significant stress.
Uncovering Cascading Failures with Network Latency
In a microservices architecture, a single slow dependency can trigger a domino effect, leading to system-wide failure. Injecting network latency is the perfect method for discovering these latent time bombs.
-
Problem Statement: A critical downstream dependency, such as a payment gateway, experiences a sudden increase in response time. Do upstream services handle this gracefully with appropriate timeouts and circuit breakers, or do they block, exhaust their thread pools, and eventually crash?
-
Experiment Design: Inject 400ms of network latency between your
checkout-serviceand itspayment-gatewaydependency for two minutes. This simulates a common and insidious real-world problem—performance degradation, not a full outage. -
Expected Outcome: The
checkout-serviceshould rapidly detect the increased latency, causing its circuit breaker to trip. This would immediately stop new requests from piling up, allowing the service to fail fast and return a clean error to the user, thereby protecting the health of the overall system.
By running these realistic failure simulations, you are not just hoping your system is resilient—you are building hard, evidence-based confidence that it can withstand the turbulent conditions of production.
Answering Your Toughest Chaos Questions
Even after understanding the core concepts, several key technical and procedural questions often arise. This section addresses the most common inquiries from engineering teams adopting chaos engineering.
Is This Just Another Name for Breaking Production?
No, it is the opposite. Chaos engineering is a disciplined, controlled practice designed to prevent production from breaking unexpectedly.
It is not about random, reckless actions. Every chaos experiment is meticulously planned with a limited blast radius, a clear hypothesis, and automated safety controls like an emergency stop. The objective is to discover weaknesses in a safe, controlled manner so they can be remediated before they cause a customer-facing outage.
How Is Chaos Engineering Different from Fault Injection?
This is a critical distinction. Fault injection is a technique—the act of introducing an error into a system (e.g., terminating a process, dropping network packets). Chaos engineering is the scientific methodology that uses fault injection to conduct controlled experiments.
The primary difference is the process. Chaos engineering is not just about breaking a component. It involves defining a system's "steady state," forming a falsifiable hypothesis, running a controlled experiment in a production or production-like environment, and analyzing the results to uncover systemic weaknesses.
Where Should I Start Chaos Engineering?
The universally accepted best practice is to start in a non-production environment. Begin in a development or staging environment that is a high-fidelity replica of your production stack. This allows your team to develop proficiency with the tools and methodology without any risk to customers.
Select a non-critical, internal service with well-understood dependencies for your first experiments. As you build confidence and your systems become demonstrably more resilient, you can methodically and carefully begin running experiments in production, where the most valuable insights are found.
Ready to build resilient systems without the guesswork? OpsMoon connects you with the top 0.7% of DevOps engineers who can implement chaos engineering and harden your infrastructure. Start with a free work planning session to map out your reliability roadmap today.