Top Site Reliability Engineering Best Practices for 2025
 By opsmoon
Discover essential site reliability engineering best practices for 2025 to optimize performance and ensure system reliability. Learn more now!
Site Reliability Engineering (SRE) is a disciplined, software-driven approach to creating scalable and highly reliable systems. While the principles are widely discussed, their practical application is what separates resilient infrastructure from a system prone to constant failure. Moving beyond generic advice, this article provides a detailed, technical roadmap of the most critical site reliability engineering best practices. Each point is designed to be immediately actionable, offering specific implementation details, tool recommendations, and concrete technical examples.
This guide is for engineers and technical leaders who need to build, maintain, and improve systems with precision and confidence. We will cover everything from defining Service Level Objectives (SLOs) and implementing comprehensive observability to mastering incident response and leveraging chaos engineering. Establishing a strong foundation of good software engineering practices is essential for creating reliable systems, and SRE provides the specialized framework to ensure that reliability is not just a goal, but a measurable and consistently achieved outcome.
You will learn how to translate reliability targets into actionable error budgets, automate infrastructure with code, and conduct blameless post-mortems that drive meaningful improvements. This is not a high-level overview; it is a blueprint for building bulletproof systems.
1. Service Level Objectives (SLOs) and Error Budgets
At the core of SRE lies a fundamental shift from reactive firefighting to a proactive, data-driven framework for managing service reliability. Service Level Objectives (SLOs) and Error Budgets are the primary tools that enable this transition. An SLO is a precise, measurable target for a service's performance, such as 99.9% availability or a 200ms API response latency, measured over a specific period. The Service Level Indicator (SLI) is the actual metric being measured—for example, the proportion of successful HTTP requests (count(requests_5xx) / count(total_requests)). The SLO is the target value for that SLI (e.g., SLI < 0.1%).
The real power of this practice emerges with the concept of an Error Budget. Calculated as 100% minus the SLO target, the error budget quantifies the acceptable level of unreliability. For a 99.9% availability SLO, the error budget is 0.1%, translating to a specific amount of permissible downtime (e.g., about 43 minutes per month). This budget isn't a license to fail; it's a resource to be spent strategically on innovation, such as deploying new features or performing system maintenance, without jeopardizing user trust.
How SLOs Drive Engineering Decisions
Instead of debating whether a system is "reliable enough," teams use the error budget to make objective, data-informed decisions. If the budget is healthy, engineering teams have a green light to push new code and innovate faster. Conversely, if the budget is depleted or at risk, the team’s priority automatically shifts to reliability work, halting non-essential deployments until the service is stabilized.
This creates a self-regulating system that aligns engineering priorities with user expectations and business goals. For example, a Prometheus query for a 99.9% availability SLO on HTTP requests might look like this: sum(rate(http_requests_total{status_code=~"5.."}[30d])) / sum(rate(http_requests_total[30d])). If this value exceeds 0.001, the error budget is exhausted.
The following concept map illustrates the direct relationship between setting an SLO, deriving an error budget, and using it to balance innovation with stability.
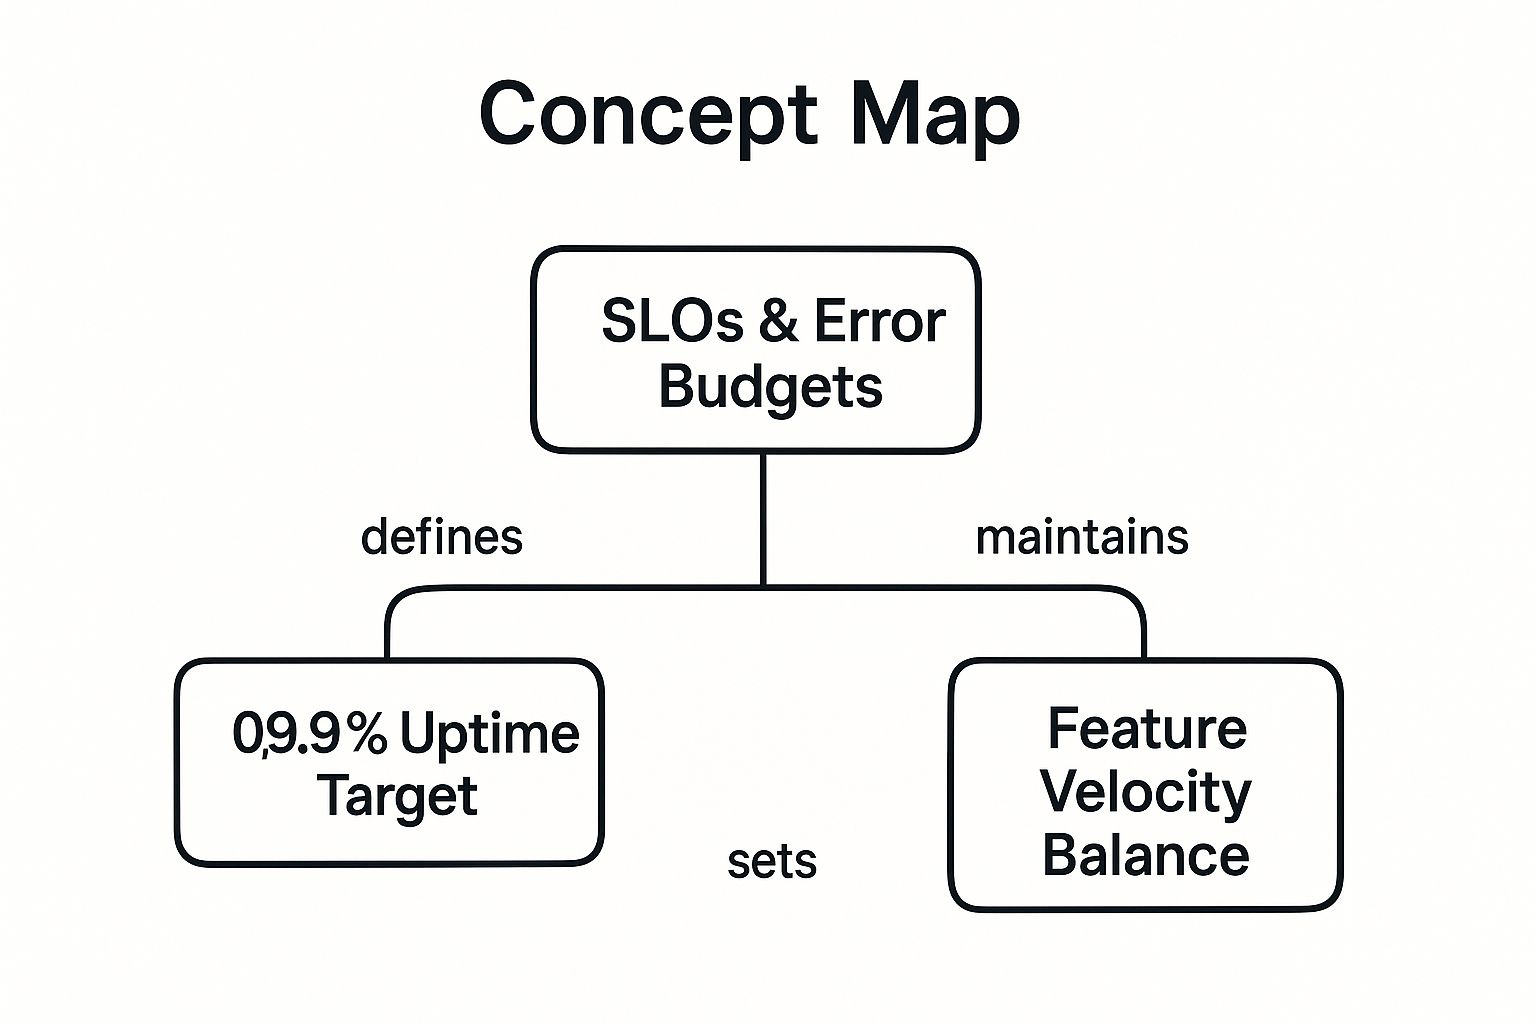
This visualization highlights how a specific uptime target directly creates a quantifiable error budget, which then serves as the critical mechanism for balancing feature velocity against reliability work.
Actionable Implementation Tips
To effectively integrate SLOs into your workflow:
- Start with User-Facing Metrics: Focus on SLIs that represent the user journey. For an e-commerce site, this could be the success rate of the checkout API (
checkout_api_success_rate) or the latency of product page loads (p95_product_page_latency_ms). Avoid internal metrics like CPU utilization unless they directly correlate with user-perceived performance. - Set Realistic Targets: Base your SLOs on established user expectations and business requirements, not just on what your system can currently achieve. A 99.999% SLO may be unnecessary and prohibitively expensive if users are satisfied with 99.9%.
- Automate and Visualize: Implement monitoring to track your SLIs against SLOs in real-time using tools like Prometheus and Grafana or specialized platforms like Datadog or Nobl9. Create dashboards that display the remaining error budget and its burn-down rate to make it visible to the entire team.
- Establish Clear Policies: Codify your error budget policy in a document. For example: "If the 30-day error budget burn rate projects exhaustion before the end of the window, all feature deployments to the affected service are frozen. The on-call team is authorized to prioritize reliability work, including bug fixes and performance improvements."
2. Comprehensive Monitoring and Observability
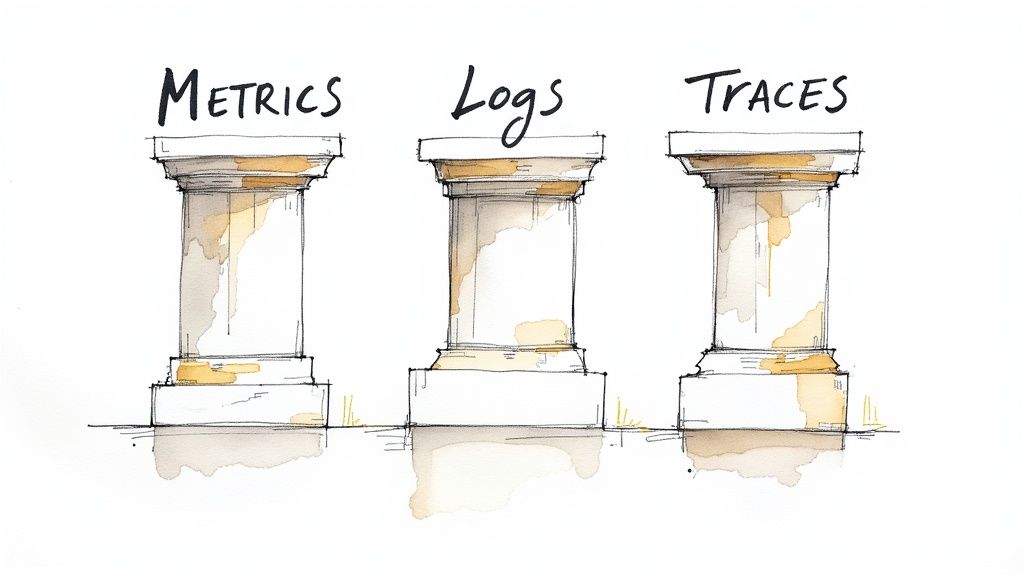
While monitoring tells you whether a system is working, observability tells you why it isn’t. This practice is a cornerstone of modern site reliability engineering best practices, evolving beyond simple health checks to provide deep, actionable insights into complex distributed systems. It’s a systematic approach to understanding internal system behavior through three primary data types: metrics (numeric measurements), logs (event records), and traces (requests tracked across multiple services).
True observability allows engineers to ask novel questions about their system's state without needing to ship new code or pre-define every potential failure mode. For instance, you can ask, "What is the p99 latency for users on iOS in Germany who are experiencing checkout failures?" This capability is crucial for debugging the "unknown unknowns" that frequently arise in microservices architectures and cloud-native environments. By instrumenting code to emit rich, contextual data, teams can diagnose root causes faster, reduce mean time to resolution (MTTR), and proactively identify performance bottlenecks.
How Observability Powers Proactive Reliability
Instead of waiting for an outage, SRE teams use observability to understand system interactions and performance degradation in real-time. This proactive stance helps connect technical performance directly to business outcomes. For example, a sudden increase in 4xx errors on an authentication service, correlated with a drop in user login metrics, immediately points to a potential problem with a new client release.
This shift moves teams from a reactive "break-fix" cycle to a state of continuous improvement. By analyzing telemetry data, engineers can identify inefficient database queries from traces, spot memory leaks from granular metrics, or find misconfigurations in logs. This data-driven approach is fundamental to managing the scale and complexity of today’s software.
Actionable Implementation Tips
To build a robust observability practice:
- Implement the RED Method: For every service, instrument and dashboard the following: Rate (requests per second), Errors (the number of failing requests, often as a rate), and Duration (histograms of request latency, e.g., p50, p90, p99). Use a standardized library like Micrometer (Java) or Prometheus client libraries to ensure consistency.
- Embrace Distributed Tracing: Instrument your application code using the OpenTelemetry standard. Propagate trace context (e.g., W3C Trace Context headers) across service calls. Configure your trace collector to sample intelligently, perhaps capturing 100% of erroring traces but only 5% of successful ones to manage data volume.
- Link Alerts to Runbooks: Every alert should be actionable. An alert for
HighDBLatencyshould link directly to a runbook that contains diagnostic steps, such aspg_stat_activityqueries to check for long-running transactions, commands to check for lock contention, and escalation procedures. - Structure Your Logs: Don't log plain text strings. Log structured data (e.g., JSON) with consistent fields like
user_id,request_id, andservice_name. This allows you to query your logs with tools like Loki or Splunk to quickly filter and analyze events during an investigation.
3. Automation and Infrastructure as Code (IaC)
Manual intervention is the enemy of reliability at scale. One of the core site reliability engineering best practices is eliminating human error and inconsistency by codifying infrastructure management. Infrastructure as Code (IaC) is the practice of managing and provisioning computing infrastructure through machine-readable definition files (e.g., HCL for Terraform, YAML for Kubernetes), rather than physical hardware configuration or interactive configuration tools. It treats your servers, networks, and databases just like application code: versioned, tested, and repeatable.
This approach transforms infrastructure deployment from a manual, error-prone task into an automated, predictable, and idempotent process. By defining infrastructure in code using tools like Terraform, Pulumi, or AWS CloudFormation, teams can create identical environments for development, staging, and production, which drastically reduces "it works on my machine" issues. This systematic management is a cornerstone of building scalable and resilient systems.
How IaC Enhances System Reliability
The primary benefit of IaC is consistency. Every change to your infrastructure is managed via a pull request, peer-reviewed, tested in a CI pipeline, and tracked in a version control system like Git. This creates a transparent and auditable history. If a faulty change is deployed (e.g., a misconfigured security group rule), rolling back is as simple as running git revert and applying the previous known-good state with terraform apply.
This practice also enables disaster recovery scenarios that are impossible with manual management. In the event of a regional failure, a new instance of your entire stack can be provisioned in a different region by running your IaC scripts, reducing Recovery Time Objective (RTO) from days to minutes. This level of automation is critical for meeting stringent availability SLOs.
The following graphic illustrates how IaC turns complex infrastructure setups into manageable, version-controlled code, enabling consistent deployments across all environments.

This visualization highlights the central concept of IaC: treating infrastructure provisioning with the same rigor and automation as application software development, which is a key tenet of SRE.
Actionable Implementation Tips
To effectively adopt IaC and automation:
- Start Small and Iterate: Begin by codifying a single, stateless service or a non-critical environment. Use Terraform to define a virtual machine, its networking rules, and a simple web server. Perfect the workflow in this isolated scope before tackling stateful systems like databases.
- Embrace Immutable Infrastructure: Instead of logging into a server to apply a patch (
ssh server && sudo apt-get update), build a new base image (e.g., an AMI) using a tool like Packer, update your IaC definition to use the new image ID, and deploy new instances, terminating the old ones. This prevents configuration drift. - Test Your Infrastructure Code: Use tools like
tflintfor static analysis of Terraform code and Terratest for integration testing. In your CI pipeline, always run aterraform planto generate an execution plan and have a human review it before an automatedterraform applyis triggered on the production environment. - Integrate into CI/CD Pipelines: Use a tool like Atlantis or a standard CI/CD system (e.g., GitLab CI, GitHub Actions) to automate the application of IaC changes. A typical pipeline: developer opens a pull request -> CI runs
terraform planand posts the output as a comment -> a team member reviews and approves -> on merge, CI runsterraform apply. For more insights, you can learn about Infrastructure as Code best practices on opsmoon.com.
4. Incident Response and Post-Mortem Analysis
Effective SRE isn't just about preventing failures; it's about mastering recovery. A structured approach to incident response is essential for minimizing downtime and impact. This practice moves beyond chaotic, ad-hoc reactions and establishes a formal process with defined roles (Incident Commander, Communications Lead, Operations Lead), clear communication channels (a dedicated Slack channel, a video conference bridge), and predictable escalation paths.
The second critical component is the blameless post-mortem analysis. After an incident is resolved, the focus shifts from "who caused the problem?" to "what systemic conditions, process gaps, or technical vulnerabilities allowed this to happen?" This cultural shift, popularized by pioneers like John Allspaw, fosters psychological safety and encourages engineers to identify root causes without fear of reprisal. The goal is to produce a prioritized list of actionable follow-up tasks (e.g., "Add circuit breaker to payment service," "Improve alert threshold for disk space") that strengthen the system.
How Incident Management Drives Reliability
A well-defined incident response process transforms a crisis into a structured, manageable event. During an outage, a designated Incident Commander (IC) takes charge of coordination, allowing engineers to focus on technical diagnosis without being distracted by stakeholder communication. This structured approach directly reduces Mean Time to Resolution (MTTR), a key SRE metric. An IC's commands might be as specific as "Ops lead, please failover the primary database to the secondary region. Comms lead, update the status page with the 'Investigating' template."
This framework creates a powerful feedback loop for continuous improvement. The action items from a post-mortem for a database overload incident might include implementing connection pooling, adding read replicas, and creating new alerts for high query latency. A well-documented process is the cornerstone; having an effective incident response policy ensures that every incident, regardless of severity, becomes a learning opportunity.
Actionable Implementation Tips
To embed this practice into your engineering culture:
- Develop Incident Response Playbooks: For critical services, create technical runbooks. For a database failure, this should include specific commands to check replica lag (
SHOW SLAVE STATUS), initiate a failover, and validate data integrity post-failover. These should be living documents, updated after every relevant incident. - Practice with Game Days: Regularly simulate incidents. Use a tool like Gremlin to inject latency into a service in a staging environment and have the on-call team run through the corresponding playbook. This tests both the technical procedures and the human response.
- Focus on Blameless Post-Mortems: Use a standardized post-mortem template that includes sections for: timeline of events with data points, root cause analysis (using techniques like the "5 Whys"), impact on users and SLOs, and a list of concrete, assigned action items with due dates.
- Publish and Share Learnings: Store post-mortem documents in a central, searchable repository (e.g., Confluence). Hold a regular meeting to review recent incidents and their follow-ups with the broader engineering organization to maximize learning. You can learn more about incident response best practices to refine your approach.
5. Chaos Engineering and Resilience Testing
While many SRE practices focus on reacting to or preventing known failures, Chaos Engineering proactively seeks out the unknown. This discipline involves intentionally injecting controlled failures into a system, such as terminating Kubernetes pods, introducing network latency between services, or maxing out CPU on a host, to uncover hidden weaknesses before they cause widespread outages. By experimenting on a distributed system in a controlled manner, teams build confidence in their ability to withstand turbulent, real-world conditions.
The core idea is to treat the practice of discovering failures as a scientific experiment. You start with a hypothesis about steady-state behavior: "The system will maintain a 99.9% success rate for API requests even if one availability zone is offline." Then, you design and run an experiment to either prove or disprove this hypothesis. This makes it one of the most effective site reliability engineering best practices for building truly resilient architectures.

How Chaos Engineering Builds System Confidence
Instead of waiting for a dependency to fail unexpectedly, Chaos Engineering allows teams to find vulnerabilities on their own terms. This practice hardens systems by forcing engineers to design for resilience from the ground up, implementing mechanisms like circuit breakers, retries with exponential backoff, and graceful degradation. It shifts the mindset from "hoping things don't break" to "knowing exactly how they break and ensuring the impact is contained."
Pioneered by teams at Netflix with Chaos Monkey, this practice is now widely adopted. A modern experiment might use a tool like LitmusChaos to randomly delete pods belonging to a specific Kubernetes deployment. The success of the experiment is determined by whether the deployment's SLOs (e.g., latency, error rate) remain within budget during the turmoil, proving that the system's self-healing and load-balancing mechanisms are working correctly.
Actionable Implementation Tips
To effectively integrate Chaos Engineering into your SRE culture:
- Start Small and in Pre-Production: Begin with a simple experiment in a staging environment. For example, use the
stress-ngtool to inflict CPU load on a single host and observe if your auto-scaling group correctly launches a replacement instance and traffic is rerouted. - Formulate a Clear Hypothesis: Be specific. Instead of "the system should be fine," use a hypothesis like: "Injecting 100ms of latency between the web-api and user-db services will cause the p99 response time of the
/users/profileendpoint to increase by no more than 150ms and the error rate to remain below 0.5%." - Measure Impact on Key Metrics: Your observability platform is your lab notebook. During an experiment, watch your key SLIs on a dashboard. The experiment is a failure if your SLOs are breached, which is a valuable learning opportunity.
- Always Have a "Stop" Button: Use tools that provide an immediate "abort" capability. For more advanced setups, automate the halt condition. For example, configure your chaos engineering tool to automatically stop the experiment if a key Prometheus alert (like
ErrorBudgetBurnTooFast) fires.
6. Capacity Planning and Performance Engineering
Anticipating future demand is a cornerstone of proactive reliability. Capacity Planning and Performance Engineering is the practice of predicting future resource needs (CPU, memory, network bandwidth, database IOPS) and optimizing system performance to meet that demand efficiently. It moves teams from reacting to load-induced failures to strategically provisioning resources based on data-driven forecasts.
This practice involves a continuous cycle of monitoring resource utilization, analyzing growth trends (e.g., daily active users), and conducting rigorous load testing using tools like k6, Gatling, or JMeter. The goal is to understand a system’s saturation points and scaling bottlenecks before users do. By proactively scaling infrastructure and fine-tuning application performance (e.g., optimizing database queries, caching hot data), SRE teams prevent performance degradation and costly outages. This is a key discipline within the broader field of site reliability engineering best practices.
How Capacity Planning Drives Engineering Decisions
Effective capacity planning provides a clear roadmap for infrastructure investment and architectural evolution. Instead of guessing how many servers are needed, teams can create a model: "Our user service can handle 1,000 requests per second per vCPU with p99 latency under 200ms. Based on a projected 20% user growth next quarter, we need to add 10 more vCPUs to the cluster." This data-driven approach allows for precise, cost-effective scaling.
For example, when preparing for a major sales event, an e-commerce platform will run load tests that simulate expected traffic patterns, identifying bottlenecks like a database table with excessive lock contention or a third-party payment gateway with a low rate limit. These findings drive specific engineering work weeks before the event, ensuring the system can handle the peak load gracefully.
Actionable Implementation Tips
To effectively integrate capacity planning and performance engineering into your workflow:
- Model at Multiple Horizons: Create short-term (weekly) and long-term (quarterly/yearly) capacity forecasts. Use time-series forecasting models (like ARIMA or Prophet) on your key metrics (e.g., QPS, user count) to predict future load.
- Incorporate Business Context: Correlate technical metrics with business events. Overlay your traffic graphs with marketing campaigns, feature launches, and geographic expansions. This helps you understand the drivers of load and improve your forecasting accuracy.
- Automate Load Testing: Integrate performance tests into your CI/CD pipeline. A new code change should not only pass unit and integration tests but also a performance regression test that ensures it hasn't degraded key endpoint latency or increased resource consumption beyond an acceptable threshold.
- Evaluate Both Scaling Strategies: Understand the technical trade-offs. Vertical scaling (e.g., changing an AWS EC2 instance from
t3.largetot3.xlarge) is simpler but has upper limits. Horizontal scaling (adding more instances) offers greater elasticity but requires your application to be stateless or have a well-managed shared state.
7. Deployment Strategies and Release Engineering
How software is delivered to production is just as critical as the code itself. In SRE, deployment is a controlled, systematic process designed to minimize risk. This practice moves beyond simple "push-to-prod" scripts, embracing sophisticated release engineering techniques like blue-green deployments, canary releases, and feature flags to manage change safely at scale.
These strategies allow SRE teams to introduce new code to a small subset of users or infrastructure, monitor its impact on key service level indicators, and decide whether to proceed with a full rollout or initiate an immediate rollback. This approach fundamentally de-risks the software release cycle by making deployments routine, reversible, and observable. A Kubernetes deployment using a RollingUpdate strategy is a basic example; a more advanced canary release would use a service mesh like Istio or Linkerd to precisely control traffic shifting based on real-time performance metrics.
How Deployment Strategies Drive Reliability
Rather than a "big bang" release, SRE teams use gradual rollouts to limit the blast radius of potential failures. For example, a canary release might deploy a new version to just 1% of traffic. An automated analysis tool like Flagger or Argo Rollouts would then query Prometheus for the canary's performance. If canary_error_rate < baseline_error_rate and canary_p99_latency < baseline_p99_latency * 1.1, the rollout proceeds to 10%. If metrics degrade, the tool automatically rolls back the change, impacting only a small fraction of users.
This methodology creates a crucial safety net that enables both speed and stability. Feature flags (or feature toggles) take this a step further, decoupling code deployment from feature release. A new, risky feature can be deployed to production "dark" (turned off), enabled only for internal users or a small beta group, and turned off instantly via a configuration change if it causes problems, without needing a full redeployment. These are cornerstones of modern site reliability engineering best practices. For a deeper dive into structuring your releases, you can learn more about the software release cycle on opsmoon.com.
Actionable Implementation Tips
To implement robust deployment strategies in your organization:
- Decouple Deployment from Release: Use a feature flagging system like LaunchDarkly or an open-source alternative. Wrap new functionality in a flag:
if (featureFlags.isEnabled('new-checkout-flow', user)) { // new code } else { // old code }. This allows you to roll out the feature to specific user segments and instantly disable it if issues arise. - Automate Rollbacks: Configure your deployment tool to automatically roll back on SLO violations. In Argo Rollouts, you can define an
AnalysisTemplatethat queries Prometheus for your key SLIs. If the query fails to meet the defined success condition, the rollout is aborted and reversed. - Implement Canary Releases: Use a service mesh or ingress controller that supports traffic splitting. Start by routing a small, fixed percentage of traffic (e.g., 1-5%) to the new version. Monitor a dedicated dashboard comparing the canary and primary versions side-by-side for error rates, latency, and resource usage.
- Standardize the Deployment Process: Use a continuous delivery platform like Spinnaker, Argo CD, or Harness to create a unified deployment pipeline for all services. This enforces best practices, provides a clear audit trail, and reduces the cognitive load on engineers.
7 Best Practices Comparison Matrix
| Item | Implementation Complexity | Resource Requirements | Expected Outcomes | Ideal Use Cases | Key Advantages |
|---|---|---|---|---|---|
| Service Level Objectives (SLOs) and Error Budgets | Moderate – requires metric selection and organizational buy-in | Moderate – metric collection and analysis tools | Balanced reliability and feature velocity | Teams balancing feature releases with reliability | Objective reliability targets; clear decision framework; accountability |
| Comprehensive Monitoring and Observability | High – involves multiple data sources and expertise | High – storage, processing, dashboards, alerting | Rapid incident detection and root cause analysis | Complex systems needing real-time visibility | Deep system insights; proactive anomaly detection; supports capacity planning |
| Automation and Infrastructure as Code (IaC) | Moderate to High – tooling setup and training needed | Moderate – automation tools and version control | Consistent, repeatable infrastructure deployment | Environments requiring frequent provisioning and scaling | Eliminates manual errors; rapid environment reproduction; audit trails |
| Incident Response and Post-Mortem Analysis | Moderate – requires defined roles and processes | Low to Moderate – communication tools and training | Faster incident resolution and organizational learning | Organizations focusing on reliability and blameless culture | Reduces MTTR; improves learning; fosters team confidence |
| Chaos Engineering and Resilience Testing | High – careful experiment design and control needed | High – mature monitoring and rollback capabilities | Increased system resilience and confidence | Mature systems wanting to proactively find weaknesses | Identifies weaknesses pre-outage; validates recovery; improves response |
| Capacity Planning and Performance Engineering | High – involves data modeling and testing | Moderate – monitoring and load testing tools | Optimized resource use and prevented outages | Growing systems needing proactive scaling | Prevents outages; cost optimization; consistent user experience |
| Deployment Strategies and Release Engineering | Moderate to High – requires advanced deployment tooling | Moderate – deployment pipeline automation and monitoring | Reduced deployment risk and faster feature delivery | Systems with frequent releases aiming for minimal downtime | Risk mitigation in deployment; faster feature rollout; rollback capabilities |
From Theory to Practice: Embedding Reliability in Your Culture
We have journeyed through the core tenets of modern system reliability, from the data-driven precision of Service Level Objectives (SLOs) to the proactive resilience testing of Chaos Engineering. Each of the site reliability engineering best practices we've explored is a powerful tool on its own. However, their true potential is unlocked when they are woven together into the fabric of your engineering culture, transforming reliability from a reactive task into a proactive, shared responsibility.
The transition from traditional operations to a genuine SRE model is more than a technical migration; it's a fundamental mindset shift. It moves your organization away from a culture of blame towards one of blameless post-mortems and collective learning. It replaces gut-feel decisions with the objective clarity of error budgets and observability data. Ultimately, it elevates system reliability from an IT-specific concern to a core business enabler that directly impacts user trust, revenue, and competitive standing.
Your Roadmap to SRE Maturity
Implementing these practices is an iterative process, not a one-time project. Your goal is not perfection on day one, but continuous, measurable improvement. To translate these concepts into tangible action, consider the following next steps:
- Start with Measurement: You cannot improve what you cannot measure. Begin by defining an SLI and SLO for a single critical, user-facing endpoint (e.g., the login API's success rate). Instrument it, build a Grafana dashboard showing the SLI and its corresponding error budget, and review it weekly with the team.
- Automate Your Toil: Identify the most repetitive, manual operational task that consumes your team's time, like provisioning a new development environment or rotating credentials. Use Infrastructure as Code (IaC) tools like Terraform or a simple shell script to automate it. This initial win builds momentum and frees up engineering hours.
- Conduct Your First Blameless Post-Mortem: The next time an incident occurs, no matter how small, commit to a blameless analysis. Use a template that focuses on the timeline of events, contributing systemic factors, and generates at least two concrete, assigned action items to prevent recurrence.
Mastering these site reliability engineering best practices is a commitment to building systems that are not just stable, but are also antifragile, scalable, and engineered for the long term. It's about empowering your teams with the tools and autonomy to build, deploy, and operate services with confidence. By embracing this philosophy, you are not merely preventing outages; you are building a resilient organization and a powerful competitive advantage.
Ready to accelerate your SRE journey but need the specialized expertise to lead the way? OpsMoon connects you with the world's top 0.7% of freelance SRE and platform engineering talent. Build your roadmap and execute with confidence by partnering with elite, vetted experts who can implement these best practices from day one.