7 Site Reliability Engineer Best Practices for 2025
 By opsmoon
Discover 7 technical site reliability engineer best practices. Learn actionable strategies for SLOs, automation, and observability to boost system reliability.
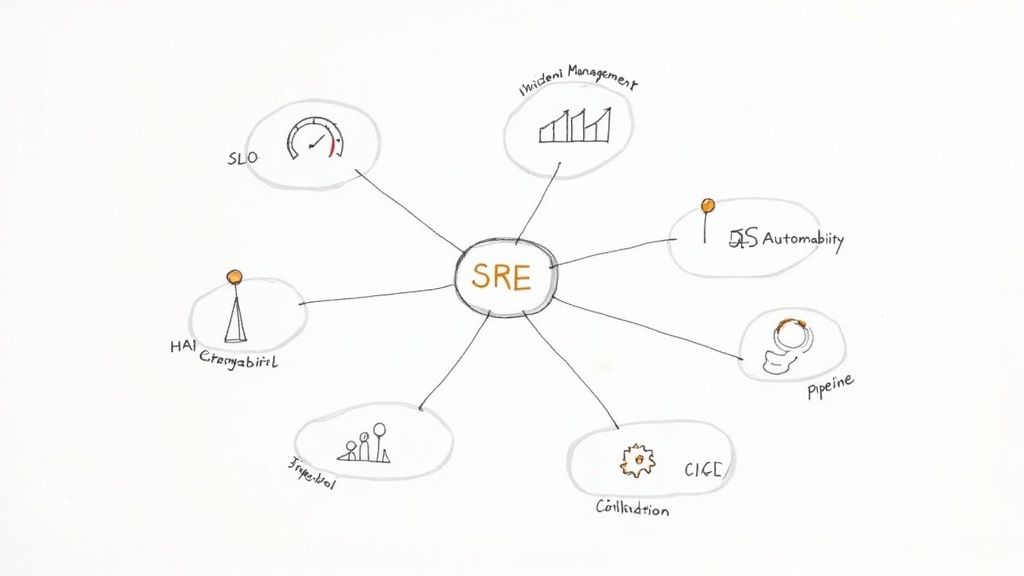
Moving beyond the buzzwords, Site Reliability Engineering (SRE) offers a disciplined, data-driven framework for creating scalable and resilient systems. But implementing SRE effectively requires more than just adopting the title; it demands a commitment to a specific set of engineering practices that bridge the gap between development velocity and operational stability. True reliability isn't an accident, it’s a direct result of intentional design and rigorous, repeatable processes.
This guide breaks down seven core site reliability engineer best practices, providing actionable, technical steps to move from conceptual understanding to practical implementation. We will explore the precise mechanics of defining reliability with Service Level Objectives (SLOs), managing error budgets, and establishing a culture of blameless postmortems. You will learn how to leverage Infrastructure as Code (IaC) for consistent environments and build comprehensive observability pipelines that go beyond simple monitoring.
Whether you're refining your automated incident response, proactively testing system resilience with chaos engineering, or systematically eliminating operational toil, these principles are the building blocks for a robust, high-performing engineering culture. Prepare to dive deep into the technical details that separate elite SRE teams from the rest.
1. Service Level Objectives (SLOs) and Error Budget Management
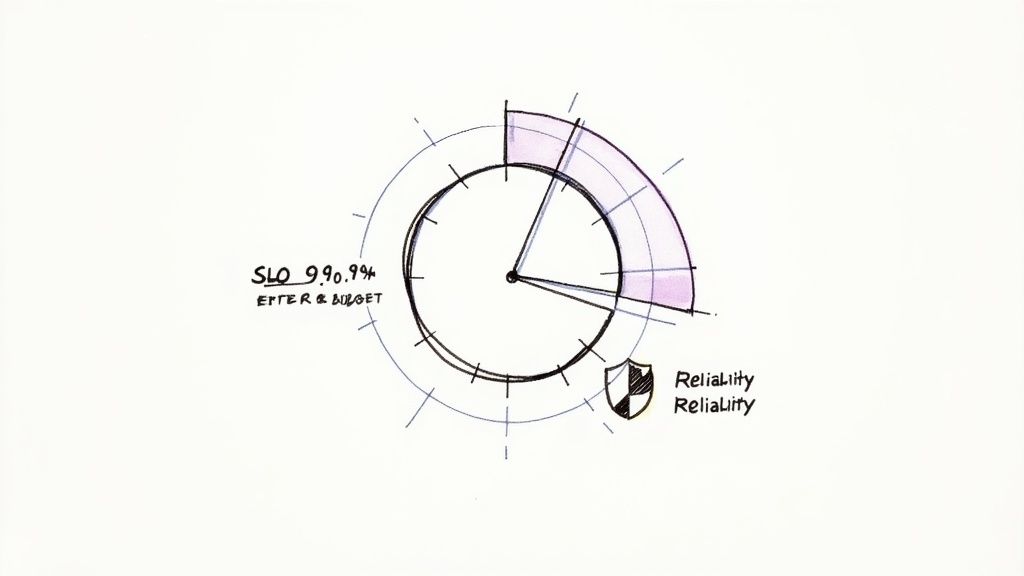
At the core of modern site reliability engineering best practices lies a data-driven framework for defining and maintaining service reliability: Service Level Objectives (SLOs) and their counterpart, error budgets. An SLO is a precise, measurable target for a service's performance over time, focused on what users actually care about. Instead of vague goals like "make the system fast," an SLO sets a concrete target, such as "99.9% of homepage requests, measured at the load balancer, will be served in under 200ms over a rolling 28-day window."
This quantitative approach moves reliability from an abstract ideal to an engineering problem. The error budget is the direct result of this calculation: (1 - SLO) * total_events. If your availability SLO is 99.9% for a service that handles 100 million requests in a 28-day period, your error budget allows for (1 - 0.999) * 100,000,000 = 100,000 failed requests. This budget represents the total downtime or performance degradation your service can experience without breaching its promise to users.
Why This Practice Is Foundational
Error budgets provide a powerful, shared language between product, engineering, and operations teams. When the error budget is plentiful, development teams have a clear green light to ship new features, take calculated risks, and innovate quickly. Conversely, when the budget is nearly exhausted, it triggers an automatic, data-driven decision to halt new deployments and focus exclusively on reliability improvements. This mechanism prevents subjective debates and aligns the entire organization around a common goal: balancing innovation with stability.
Companies like Google and Netflix have famously used this model to manage some of the world's largest distributed systems. For instance, a Netflix streaming service might have an SLO for playback success rate, giving teams a clear budget for failed stream starts before they must prioritize fixes over feature development.
How to Implement SLOs and Error Budgets
- Identify User-Centric Metrics (SLIs): Start by defining Service Level Indicators (SLIs), the raw measurements that feed your SLOs. SLIs should be expressed as a ratio of good events to total events. For example, an availability SLI would be
(successful_requests / total_requests) * 100. For a latency SLI, it would be(requests_served_under_X_ms / total_requests) * 100. - Set Realistic SLO Targets: Your initial SLO should be slightly aspirational but achievable, often just below your system's current demonstrated performance. Use historical data from your monitoring system (e.g., Prometheus queries over the last 30 days) to establish a baseline. Setting a target of 99.999% for a service that historically achieves 99.9% will only lead to constant alerts and burnout.
- Automate Budget Tracking: Implement monitoring and alerting to track your error budget consumption. Configure alerts based on the burn rate. For a 28-day window, a burn rate of 1 means you're consuming the budget at a rate that will exhaust it in exactly 28 days. A burn rate of 14 means you'll exhaust the monthly budget in just two days. A high burn rate (e.g., >10) should trigger an immediate high-priority alert, signaling that the SLO is in imminent danger.
- Establish Clear Policies: Define what happens when the error budget is depleted. This policy should be agreed upon by all stakeholders and might include a temporary feature freeze enforced via CI/CD pipeline blocks, a mandatory post-mortem for the budget-draining incident, and a dedicated engineering cycle for reliability work.
2. Comprehensive Monitoring and Observability
While traditional monitoring tells you if your system is broken, observability tells you why. This practice is a cornerstone of modern site reliability engineer best practices, evolving beyond simple health checks to provide a deep, contextual understanding of complex distributed systems. It's built on three pillars: metrics (numeric time-series data, like http_requests_total), logs (timestamped, structured event records, often in JSON), and traces (which show the path and latency of a request through multiple services via trace IDs).
This multi-layered approach allows SREs to not only detect failures but also to ask arbitrary questions about their system's state without having to ship new code. Instead of being limited to pre-defined dashboards, engineers can dynamically query high-cardinality data to debug "unknown-unknowns" – novel problems that have never occurred before. True observability is about understanding the internal state of a system from its external outputs.

Why This Practice Is Foundational
In microservices architectures, a single user request can traverse dozens of services, making root cause analysis nearly impossible with metrics alone. Observability provides the necessary context to pinpoint bottlenecks and errors. When an alert fires for high latency, engineers can correlate metrics with specific traces and logs to understand the exact sequence of events that led to the failure, drastically reducing Mean Time To Resolution (MTTR).
Tech leaders like Uber and LinkedIn rely heavily on observability. Uber developed Jaeger, an open-source distributed tracing system, to debug complex service interactions. Similarly, LinkedIn integrates metrics, logs, and traces into a unified platform to give developers a complete picture of service performance, enabling them to solve issues faster. This practice is crucial for maintaining reliability in rapidly evolving, complex environments.
How to Implement Comprehensive Monitoring and Observability
- Instrument Everything: Begin by instrumenting your applications and infrastructure to emit detailed telemetry. Use standardized frameworks like OpenTelemetry to collect metrics, logs, and traces without vendor lock-in. Ensure every log line and metric includes contextual labels like
service_name,region, andcustomer_id. - Adopt Key Frameworks: Structure your monitoring around established methods. Use the USE Method (Utilization, Saturation, Errors) for monitoring system resources (e.g., CPU utilization, queue depth, disk errors) and the RED Method (Rate, Errors, Duration) for monitoring services (e.g., requests per second, count of 5xx errors, request latency percentiles).
- Correlate Telemetry Data: Ensure your observability platform can link metrics, logs, and traces together. A spike in a metric dashboard should allow you to instantly pivot to the relevant traces and logs from that exact time period by passing a
trace_idbetween systems. To dive deeper, explore these infrastructure monitoring best practices. - Tune Alerting and Link Runbooks: Connect alerts directly to actionable runbooks. Every alert should have a clear, documented procedure for investigation and remediation. Aggressively tune alert thresholds to eliminate noise, ensuring that every notification is meaningful and requires action. Base alerts on SLOs and error budget burn rates, not on noisy symptoms like high CPU.
3. Infrastructure as Code (IaC) and Configuration Management
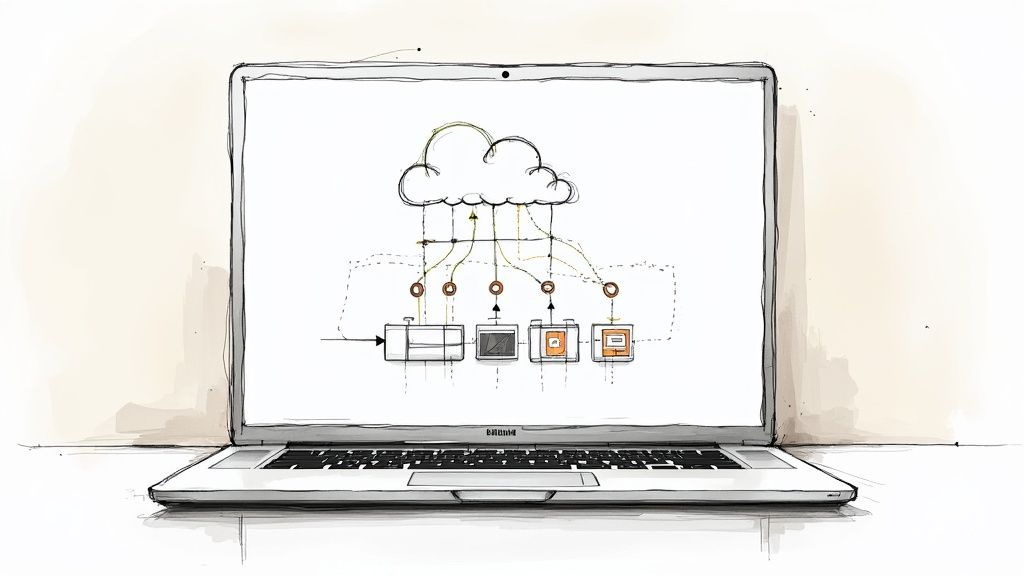
A foundational principle in modern site reliability engineering best practices is treating infrastructure with the same rigor as application code. Infrastructure as Code (IaC) is the practice of managing and provisioning computing infrastructure through machine-readable definition files, rather than through manual processes or interactive tools. This paradigm shift allows SRE teams to automate, version, and validate infrastructure changes, eliminating configuration drift and making deployments predictable and repeatable.
By defining servers, networks, and databases in code using declarative tools like Terraform or Pulumi, or imperative tools like AWS CDK, infrastructure becomes a version-controlled asset. This enables peer reviews (git pull-request), automated testing (terraform plan), and consistent, auditable deployments across all environments. Configuration management tools like Ansible or Chef then ensure that these provisioned systems maintain a desired state, applying configurations consistently and at scale.
Why This Practice Is Foundational
IaC is the bedrock of scalable and reliable systems because it makes infrastructure immutable and disposable. Manual changes lead to fragile, "snowflake" servers that are impossible to reproduce. With IaC, if a server misbehaves, it can be destroyed and recreated from code in minutes, guaranteeing a known-good state. This drastically reduces mean time to recovery (MTTR), a critical SRE metric, by replacing lengthy, stressful debugging sessions with a simple, automated redeployment.
Companies like Netflix and Shopify rely heavily on IaC to manage their vast, complex cloud environments. For example, Netflix uses a combination of Terraform and their continuous delivery platform, Spinnaker, to manage AWS resources. This allows their engineers to safely and rapidly deploy infrastructure changes needed to support new services, knowing the process is versioned, tested, and automated.
How to Implement IaC and Configuration Management
- Start Small and Incrementally: Begin by codifying a small, non-critical component of your infrastructure, like a development environment or a single stateless service. Use a tool's import functionality (e.g.,
terraform import) to bring existing manually-created resources under IaC management without destroying them. - Modularize Your Code: Create reusable, composable modules for common infrastructure patterns (e.g., a standard Kubernetes cluster configuration or a VPC network layout). This approach, central to Infrastructure as Code best practices, minimizes code duplication and makes the system easier to manage.
- Implement a CI/CD Pipeline for Infrastructure: Treat your infrastructure code just like application code. Your pipeline should automatically lint (
tflint), validate (terraform validate), and test (terratest) IaC changes on every commit. Theterraform planstage should be a mandatory review step in every pull request. - Manage State Securely and Separately: IaC tools use state files to track the resources they manage. Store this state file in a secure, remote, and versioned backend (like an S3 bucket with versioning and state locking enabled via DynamoDB). Use separate state files for each environment (dev, staging, prod) to prevent changes in one from impacting another.
4. Automated Incident Response and Runbooks
When an incident strikes, speed and accuracy are paramount. Automated Incident Response and Runbooks form a critical SRE best practice designed to minimize Mean Time to Resolution (MTTR) by combining machine-speed remediation with clear, human-guided procedures. This approach codifies institutional knowledge, turning chaotic troubleshooting into a systematic, repeatable process.
The core idea is to automate the response to known, frequent failures (e.g., executing a script to scale a Kubernetes deployment when CPU usage breaches a threshold) while providing detailed, step-by-step guides (runbooks) for engineers to handle novel or complex issues. Instead of relying on an individual's memory during a high-stress outage, teams can execute a predefined, tested plan. This dual strategy dramatically reduces human error and accelerates recovery.
Why This Practice Is Foundational
This practice directly combats alert fatigue and decision paralysis. By automating responses to common alerts, such as restarting a failed service pod or clearing a full cache, engineers are freed to focus their cognitive energy on unprecedented problems. Runbooks ensure that even junior engineers can contribute effectively during an incident, following procedures vetted by senior staff. This creates a more resilient on-call rotation and shortens the resolution lifecycle.
Companies like Facebook and Amazon leverage this at a massive scale. Facebook's FBAR (Facebook Auto-Remediation) system can automatically detect and fix common infrastructure issues without human intervention. Similarly, Amazon’s services use automated scaling and recovery procedures to handle failures gracefully during peak events like Prime Day, a feat impossible with manual intervention alone.
How to Implement Automated Response and Runbooks
- Start with High-Frequency, Low-Risk Incidents: Identify the most common alerts that have a simple, well-understood fix. Automate these first, such as a script that performs a rolling restart of a stateless service or a Lambda function that scales up a resource pool.
- Develop Collaborative Runbooks: Involve both SRE and development teams in writing runbooks in a version-controlled format like Markdown. Document everything: the exact Prometheus query to validate the problem,
kubectlcommands for diagnosis, potential remediation actions, escalation paths, and key contacts. For more details on building a robust strategy, you can learn more about incident response best practices on opsmoon.com. - Integrate Automation with Alerting: Use tools like PagerDuty or Opsgenie to trigger automated remediation webhooks directly from an alert. For example, a high-latency alert could trigger a script that gathers diagnostics (
kubectl describe pod,top) and attaches them to the incident ticket before paging an engineer. - Test and Iterate Constantly: Regularly test your runbooks and automations through chaos engineering exercises or simulated incidents (GameDays). After every real incident, conduct a post-mortem and use the lessons learned to update and improve your documentation and scripts as a required action item.
5. Capacity Planning and Performance Engineering
A core tenet of site reliability engineering best practices is shifting from reactive problem-solving to proactive prevention. Capacity planning and performance engineering embody this principle by systematically forecasting resource needs and optimizing system efficiency before demand overwhelms the infrastructure. This practice involves analyzing usage trends (e.g., daily active users), load test data, and business growth projections to ensure your services can gracefully handle future traffic without degrading performance or becoming cost-prohibitive.
Instead of waiting for a "CPU throttling" alert during a traffic spike, SREs use this discipline to model future states and provision resources accordingly. It's the art of ensuring you have exactly what you need, when you need it, avoiding both the user-facing pain of under-provisioning and the financial waste of over-provisioning. This foresight is crucial for maintaining both reliability and operational efficiency.
Why This Practice Is Foundational
Effective capacity planning directly supports service availability and performance SLOs by preventing resource exhaustion, a common cause of major outages. It provides a strategic framework for infrastructure investment, linking technical requirements directly to business goals like user growth or market expansion. This alignment allows engineering teams to justify budgets with data-driven models and build a clear roadmap for scaling.
E-commerce giants like Amazon and Target rely on meticulous capacity planning to survive massive, predictable spikes like Black Friday, where even minutes of downtime can result in millions in lost revenue. Similarly, Twitter engineers for global events like the Super Bowl, ensuring the platform remains responsive despite a deluge of real-time traffic. This proactive stance turns potential crises into non-events.
How to Implement Capacity Planning and Performance Engineering
- Monitor Leading Indicators: Don't just track CPU and memory usage. Monitor application-level metrics that predict future load, such as user sign-up rates (
new_users_per_day), API call growth from a key partner, or marketing campaign schedules. These leading indicators give you advance warning of upcoming resource needs. - Conduct Regular Load Testing: Simulate realistic user traffic and anticipated peak loads against a production-like environment. Use tools like k6, Gatling, or JMeter to identify bottlenecks in your application code, database queries (using
EXPLAIN ANALYZE), and network configuration before they affect real users. - Use Multiple Forecasting Models: Relying on simple linear regression is often insufficient. Combine it with other models, like seasonal decomposition (e.g., Prophet) for services with cyclical traffic, to create a more accurate forecast. Compare the results to build a confident capacity plan, defining both average and peak (99th percentile) resource requirements.
- Collaborate with Business Teams: Your most valuable data comes from outside the engineering department. Regularly meet with product and marketing teams to understand their roadmaps, user acquisition goals, and promotional calendars. Convert their business forecasts (e.g., "we expect 500,000 new users") into technical requirements (e.g., "which translates to 2000 additional RPS at peak").
6. Chaos Engineering and Resilience Testing
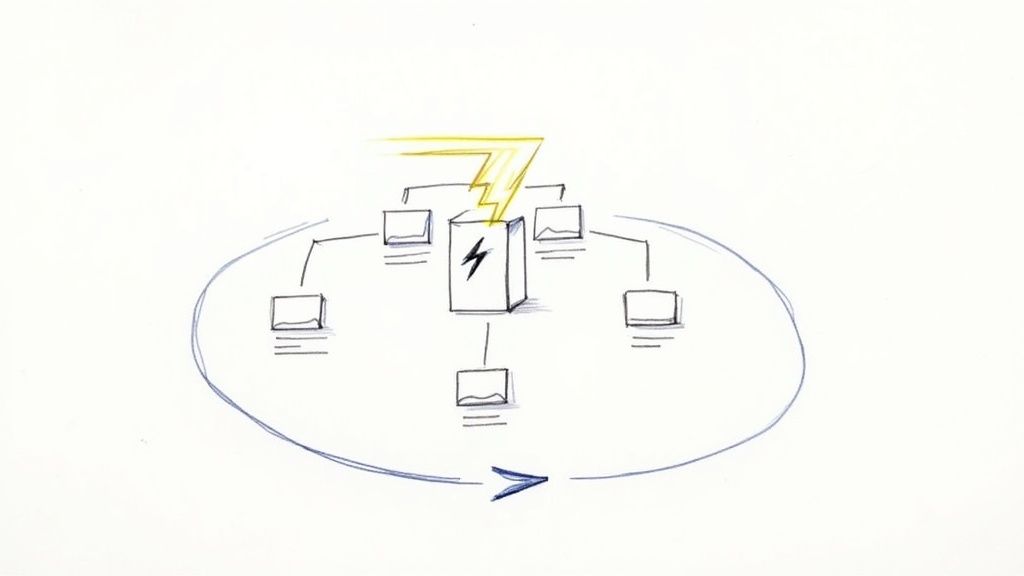
To truly build resilient systems, SREs must move beyond passive monitoring and actively validate their defenses. Chaos engineering is the discipline of experimenting on a distributed system by intentionally introducing controlled failures. This proactive approach treats reliability as a scientific problem, using controlled experiments to uncover hidden weaknesses in your infrastructure, monitoring, and incident response procedures before they manifest as real-world outages.
Instead of waiting for a failure to happen, chaos engineering creates the failure in a controlled environment. The goal is not to break things randomly but to build confidence in the system's ability to withstand turbulent, real-world conditions. By systematically injecting failures like network latency, terminated instances, or unavailable dependencies, teams can identify and fix vulnerabilities that are nearly impossible to find in traditional testing.
Why This Practice Is Foundational
Chaos engineering shifts an organization's mindset from reactive to proactive reliability. It replaces "hoping for the best" with "preparing for the worst." This practice is a cornerstone of site reliability engineer best practices because it validates that your failover mechanisms, auto-scaling groups, and alerting systems work as designed, not just as documented. It builds institutional muscle memory for incident response and fosters a culture where failures are seen as learning opportunities.
Companies like Netflix pioneered this field with tools like Chaos Monkey, which randomly terminates production instances to ensure engineers build services that can tolerate instance failure without impacting users. Similarly, Amazon conducts large-scale "GameDay" exercises, simulating major events like a full availability zone failure to test their operational readiness and improve recovery processes.
How to Implement Chaos Engineering
- Establish a Steady State: Define your system’s normal, healthy behavior through key SLIs and metrics. This baseline is crucial for detecting deviations during an experiment. For example,
p95_latency < 200msanderror_rate < 0.1%. - Formulate a Hypothesis: State a clear, falsifiable hypothesis. For example, "If we inject 300ms of latency into the primary database replica, the application will fail over to the secondary replica within 30 seconds with no more than a 1% increase in user-facing errors."
- Start Small and in Pre-Production: Begin your experiments in a staging or development environment. Start with a small "blast radius," targeting a single non-critical service or an internal-only endpoint. Use tools like LitmusChaos or Chaos Mesh to scope the experiment to specific Kubernetes pods via labels.
- Inject Variables and Run the Experiment: Use tools to introduce failures like network latency (via
tc), packet loss, or CPU exhaustion (viastress-ng). Run the experiment during business hours when your engineering team is available to observe and respond if necessary. Implement automated "stop" conditions that halt the experiment if key metrics degrade beyond a predefined threshold. - Analyze and Strengthen: Compare the results against your hypothesis. Did the system behave as expected? If not, the experiment has successfully revealed a weakness. Use the findings to create a backlog of reliability fixes (e.g., adjust timeout values, fix retry logic), update runbooks, or improve monitoring.
7. Toil Reduction and Automation
A core tenet of site reliability engineering best practices is the relentless pursuit of eliminating toil through automation. Toil is defined as operational work that is manual, repetitive, automatable, tactical, and scales linearly with service growth. This isn't just about administrative tasks; it’s the kind of work that offers no enduring engineering value and consumes valuable time that could be spent on long-term improvements.
By systematically identifying and automating these routine tasks, SRE teams reclaim their engineering capacity. Instead of manually provisioning a server with a series of ssh commands, rotating a credential, or restarting a failed service, automation handles it. This shift transforms the team's focus from being reactive firefighters to proactive engineers who build more resilient, self-healing systems.
Why This Practice Is Foundational
Toil is the enemy of scalability and innovation. As a service grows, the manual workload required to maintain it grows proportionally, eventually overwhelming the engineering team. Toil reduction directly addresses this by building software solutions to operational problems, which is the essence of the SRE philosophy. It prevents burnout, reduces the risk of human error in critical processes, and frees engineers to work on projects that create lasting value, such as improving system architecture or developing new features.
This principle is a cornerstone of how Google's SRE teams operate, where engineers are expected to spend no more than 50% of their time on operational work. Similarly, Etsy invested heavily in deployment automation to move away from error-prone manual release processes, enabling faster, more reliable feature delivery. The goal is to ensure that the cost of running a service does not grow at the same rate as its usage.
How to Implement Toil Reduction
- Quantify and Track Toil: The first step is to make toil visible. Encourage team members to log time spent on manual, repetitive tasks in their ticketing system (e.g., Jira) with a specific "toil" label. Categorize and quantify this work to identify the biggest time sinks and prioritize what to automate first.
- Prioritize High-Impact Automation: Start with the "low-hanging fruit," tasks that are frequent, time-consuming, and carry a high risk of human error. Automating common break-fix procedures (e.g., a script to clear a specific cache), certificate renewals (using Let's Encrypt and cert-manager), or infrastructure provisioning often yields the highest immediate return on investment.
- Build Reusable Automation Tools: Instead of creating one-off bash scripts, develop modular, reusable tools and services, perhaps as a command-line interface (CLI) or an internal API. A common library for interacting with your cloud provider's API, for example, can be leveraged across multiple automation projects, accelerating future efforts.
- Integrate Automation into Sprints: Treat automation as a first-class engineering project. Allocate dedicated time in your development cycles and sprint planning for building and maintaining automation. This ensures it's not an afterthought but a continuous, strategic investment. Define "Definition of Done" for new features to include runbook automation.
Site Reliability Engineer Best Practices Comparison
| Practice | Implementation Complexity | Resource Requirements | Expected Outcomes | Ideal Use Cases | Key Advantages |
|---|---|---|---|---|---|
| Service Level Objectives (SLOs) and Error Budget Management | Moderate | Requires metric tracking, monitoring tools | Balanced reliability and development velocity | Services needing clear reliability targets | Objective reliability measurement, business alignment |
| Comprehensive Monitoring and Observability | High | Significant tooling, infrastructure | Full system visibility and rapid incident detection | Complex distributed systems requiring debugging | Enables root cause analysis, proactive alerting |
| Infrastructure as Code (IaC) and Configuration Management | Moderate to High | IaC tools, version control, automation setup | Consistent, reproducible infrastructure | Environments needing repeatable infrastructure | Reduces manual errors, supports audit and recovery |
| Automated Incident Response and Runbooks | Moderate | Integration with monitoring, runbook creation | Faster incident resolution, consistent responses | Systems with frequent incidents requiring automation | Reduces MTTR, reduces human error and stress |
| Capacity Planning and Performance Engineering | High | Data collection, load testing tools | Optimized resource use and performance | Systems with variable or growing traffic | Prevents outages, cost-efficient scaling |
| Chaos Engineering and Resilience Testing | High | Mature monitoring, fail-safe automation | Increased system resilience, validated recovery | High-availability systems needing robustness | Identifies weaknesses early, improves fault tolerance |
| Toil Reduction and Automation | Moderate | Automation frameworks, process analysis | Reduced manual work, increased engineering focus | Teams with repetitive operational burdens | Frees engineering time, reduces errors and toil |
Integrating SRE: From Principles to Production-Ready Reliability
Navigating the landscape of site reliability engineering can seem complex, but the journey from principles to production-ready systems is built on a foundation of clear, actionable practices. Throughout this guide, we've explored seven pillars that transform reliability from a reactive afterthought into a core engineering discipline. By embracing these site reliability engineer best practices, you empower your teams to build, deploy, and operate systems that are not just stable, but are inherently resilient and scalable.
The path to SRE maturity is an iterative loop, not a linear checklist. Each practice reinforces the others, creating a powerful flywheel effect. SLOs and error budgets provide the quantitative language for reliability, turning abstract goals into concrete engineering targets. Comprehensive observability gives you the real-time data to measure those SLOs and quickly diagnose deviations. This data, in turn, fuels effective incident response, which is accelerated by automated runbooks and a blameless postmortem culture.
From Tactical Fixes to Strategic Engineering
Adopting these practices marks a critical shift in mindset. It's about moving beyond simply "keeping the lights on" and toward a proactive, data-driven approach.
- Infrastructure as Code (IaC) codifies your environment, making it repeatable, auditable, and less prone to manual error.
- Proactive Capacity Planning ensures your system can gracefully handle future growth, preventing performance degradation from becoming a user-facing incident.
- Chaos Engineering allows you to deliberately inject failure to uncover hidden weaknesses before they impact customers, hardening your system against the unpredictable nature of production environments.
- Aggressive Toil Reduction frees your most valuable engineers from repetitive, manual tasks, allowing them to focus on high-impact projects that drive innovation and further improve reliability.
Mastering these concepts is not just about preventing outages; it's a strategic business advantage. A reliable platform is the bedrock of customer trust, product innovation, and sustainable growth. When users can depend on your service, your development teams can ship features with confidence, knowing the error budget provides a clear buffer for calculated risks. This creates a virtuous cycle where reliability enables velocity, and velocity, guided by data, enhances the user experience. The ultimate goal is to build a self-healing, self-improving system where engineering excellence is the default state.
Ready to implement these site reliability engineer best practices but need expert guidance? OpsMoon connects you with a global network of elite, pre-vetted SRE and DevOps freelancers who can help you define SLOs, build observability pipelines, and automate your infrastructure. Accelerate your reliability journey by hiring the right talent for your project at OpsMoon.