A Practical Guide to Prometheus and Kubernetes Monitoring
 By opsmoon
Master Prometheus and Kubernetes monitoring with this end-to-end guide. Learn setup, advanced scaling with Thanos, alerting, and real-world CI/CD examples.
When running workloads on Kubernetes, legacy monitoring tools quickly prove inadequate. This is where Prometheus becomes essential. The combination of Prometheus and Kubernetes is the de-facto standard for cloud-native observability, providing engineers a powerful, open-source solution for deep visibility into cluster health and performance.
This guide is not just about metric collection; it's about implementing a technical strategy to interpret data within a highly dynamic, auto-scaling environment to ensure operational reliability.
Why Prometheus Is the Go-To for Kubernetes Monitoring
Traditional monitoring was designed for static servers with predictable lifecycles. A Kubernetes cluster, however, is ephemeral by nature—Pods and Nodes are created and destroyed in seconds. This constant churn makes push-based agents and manual configuration untenable.
Kubernetes requires a monitoring system built for this dynamic environment, which is precisely what Prometheus provides. The core challenge is not merely data acquisition but interpreting that data as the underlying infrastructure shifts. In a microservices architecture, where a single request can traverse dozens of services, a unified, label-based observability model is non-negotiable.
The Unique Demands of Containerized Environments
Monitoring containers introduces layers of complexity absent in VM monitoring. You must gain visibility into the container runtime (e.g., containerd), the orchestrator (the Kubernetes control plane), and every application running within the containers. Prometheus was designed for this cloud-native paradigm.
Here’s a breakdown of its technical advantages:
- Dynamic Service Discovery: Prometheus natively integrates with the Kubernetes API to discover scrape targets. It automatically detects new Pods and Services via
ServiceMonitorandPodMonitorresources, eliminating the need for manual configuration updates during deployments or auto-scaling events. - Multi-Dimensional Data Model: Instead of flat metric strings, Prometheus uses key-value pairs called labels. This data model provides rich context, enabling flexible and powerful queries using PromQL. You can slice and dice metrics by any label, such as
namespace,deployment, orpod_name. - High Cardinality Support: Modern applications generate a vast number of unique time series (high cardinality). Prometheus's time-series database (TSDB) is specifically engineered to handle this data volume efficiently, a common failure point for legacy monitoring systems.
A Pillar of Modern DevOps and SRE
Effective DevOps and Site Reliability Engineering (SRE) practices are impossible without robust monitoring. The insights derived from a well-configured Prometheus instance directly inform reliability improvements, performance tuning, and cost optimization strategies.
With 96% of organizations now using or evaluating Kubernetes, production-grade monitoring is a critical operational requirement.
When monitoring is treated as a first-class citizen, engineering teams can transition from a reactive "firefighting" posture to a proactive, data-driven approach. This is the only sustainable way to meet service level objectives (SLOs) and maintain system reliability.
Ultimately, choosing Prometheus and Kubernetes is a strategic architectural decision. It provides the observability foundation required to operate complex distributed systems with confidence. For a deeper dive into specific strategies, check out our guide on Kubernetes monitoring best practices.
Choosing Your Prometheus Deployment Strategy
When deploying Prometheus into a Kubernetes cluster, you face a critical architectural choice: build from the ground up using the core Operator, or deploy a pre-packaged stack. This decision balances granular control against operational convenience and will define your monitoring management workflow.
The choice hinges on your team's familiarity with Kubernetes operators and whether you require an immediate, comprehensive solution or prefer a more customized, component-based approach.
This decision tree summarizes the path to effective Kubernetes monitoring.
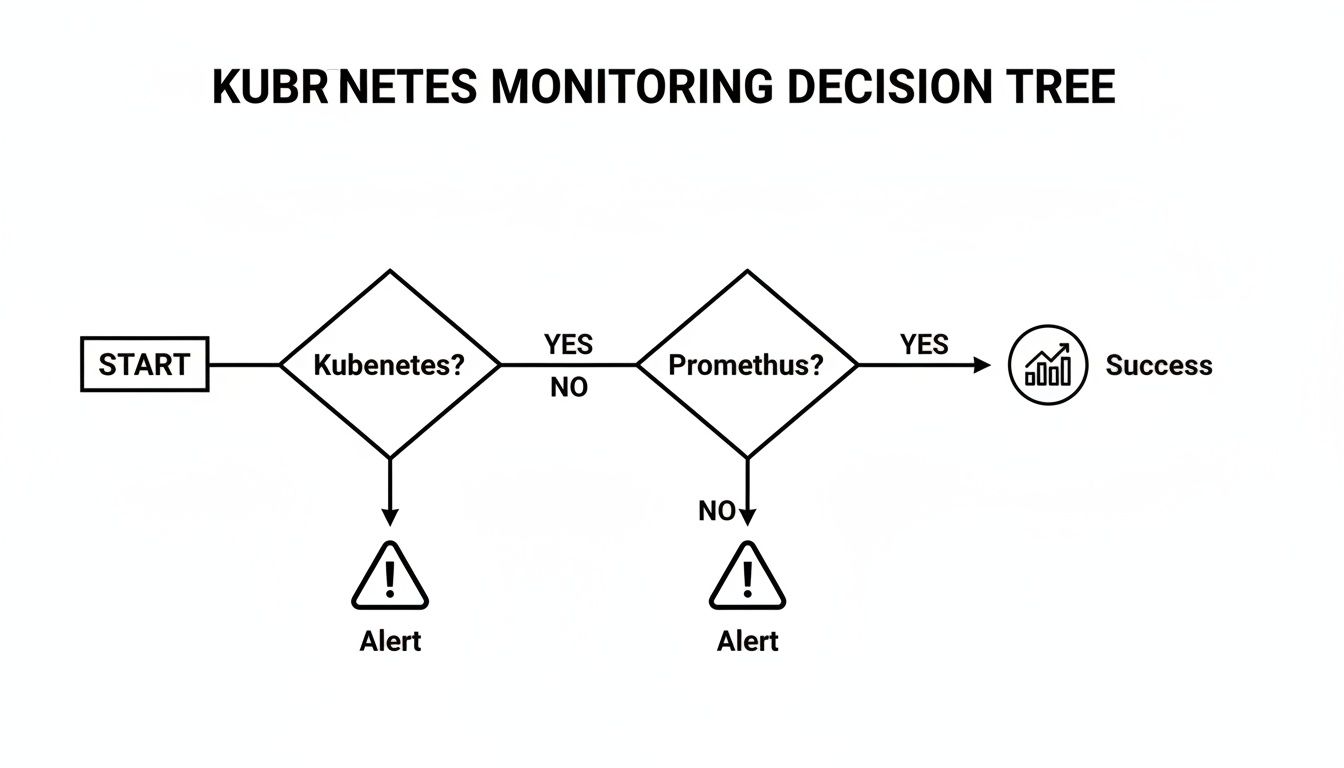
For any serious observability initiative in Kubernetes, Prometheus is the default choice that provides a direct path to actionable monitoring and alerting.
The Power of the Prometheus Operator
At the core of a modern Kubernetes monitoring architecture is the Prometheus Operator. It extends the Kubernetes API with a set of Custom Resource Definitions (CRDs) that allow you to manage Prometheus, Alertmanager, and Thanos declaratively using standard Kubernetes manifests and kubectl.
This approach replaces the monolithic prometheus.yml configuration file with version-controllable Kubernetes resources.
ServiceMonitor: This CRD declaratively specifies how a group of KubernetesServicesshould be monitored. You define aselectorto matchServicelabels, and the Operator automatically generates the corresponding scrape configurations in the underlying Prometheus config.PodMonitor: Similar toServiceMonitor, this CRD discovers pods directly based on their labels, bypassing theServiceabstraction. It is ideal for scraping infrastructure components like DaemonSets (e.g.,node-exporter) or StatefulSets where individual pod endpoints are targeted.PrometheusRule: This CRD allows you to define alerting and recording rules as distinct Kubernetes resources, making them easy to manage within a GitOps workflow.
Deploying the Operator directly provides maximum architectural flexibility, allowing you to assemble your monitoring stack with precisely the components you need.
The All-in-One Kube-Prometheus-Stack
For teams seeking a production-ready, batteries-included deployment, the kube-prometheus-stack Helm chart is the standard. This popular chart bundles the Prometheus Operator with a curated collection of essential monitoring components.
The
kube-prometheus-stackprovides the most efficient path to a robust, out-of-the-box observability solution. It bundles Grafana for dashboards and Alertmanager for notifications, all deployable with a single Helm command.
This strategy dramatically reduces initial setup time. The chart includes pre-configured dashboards for cluster health, essential exporters like kube-state-metrics and node-exporter, and a comprehensive set of default alerting rules.
Installation requires just a few Helm commands:
# Add the prometheus-community Helm repository
helm repo add prometheus-community https://prometheus-community.github.io/helm-charts
helm repo update

# Install the kube-prometheus-stack chart into a dedicated namespace
helm install prometheus prometheus-community/kube-prometheus-stack \
  --namespace monitoring --create-namespace
This command deploys a fully functional monitoring and alerting system, ready for immediate use.
Prometheus Operator vs Kube-Prometheus-Stack
The decision between the core Operator and the full stack depends on your desired level of control versus pre-configuration.
| Feature | Prometheus Operator (Core) | Kube-Prometheus-Stack (Helm Chart) |
|---|---|---|
| Components | Only the Prometheus Operator and its CRDs. | Bundles Operator, Prometheus, Grafana, Alertmanager, and key exporters. |
| Initial Setup | Requires manual installation and configuration of each component (Prometheus, Grafana, etc.). | Deploys a complete, pre-configured stack with one helm install command. |
| Configuration | Total granular control. You define every ServiceMonitor, rule, and dashboard from scratch. |
Comes with sensible defaults, pre-built dashboards, and alerting rules. |
| Flexibility | Maximum flexibility. Ideal for custom or minimalist setups. | Highly configurable via Helm values.yaml, but starts with an opinionated setup. |
| Best For | Teams building a bespoke monitoring stack or integrating with existing tools. | Most teams, especially those seeking a quick, production-ready starting point. |
| Management | Higher initial configuration effort but precise control over each component. | Lower initial effort. Abstracts away much of the initial configuration complexity. |
The kube-prometheus-stack leverages the power of the Operator, wrapping it in a convenient, feature-rich package. For most teams, it’s the ideal starting point for monitoring Prometheus and Kubernetes environments, providing a fast deployment with the ability to customize underlying CRDs as requirements evolve.
While Prometheus combined with Grafana offers a powerful, license-free observability stack, this freedom requires significant in-house expertise to manage and scale. You can learn more about the trade-offs among leading Kubernetes observability tools to evaluate its fit for your organization.
Automating Service Discovery and Metric Collection
Manually configuring Prometheus scrape targets in a Kubernetes cluster is fundamentally unscalable. Any static configuration becomes obsolete the moment a deployment scales or a pod is rescheduled. The powerful synergy of Prometheus and Kubernetes lies in automated, dynamic service discovery.
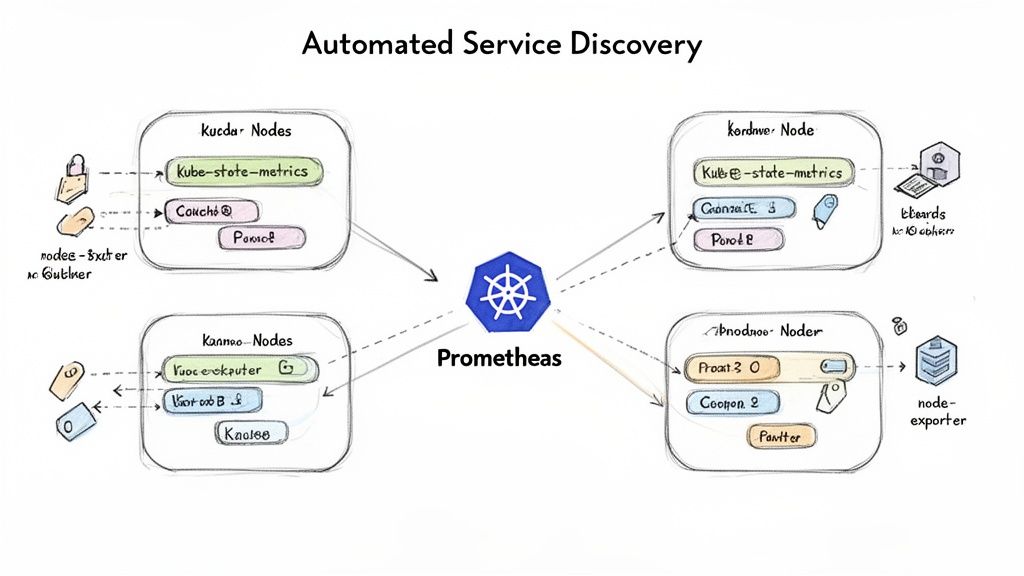
Instead of resisting Kubernetes's dynamic nature, we leverage it. By using the Prometheus Operator's CRDs, we declaratively define what to monitor, while the Operator handles the how. This system relies on Kubernetes labels and selectors to transform a tedious manual process into a seamless, automated workflow. For a foundational understanding, review our article explaining what service discovery is.
Using ServiceMonitor for Application Metrics
The ServiceMonitor is the primary tool for discovering and scraping metrics from applications. It is designed to watch for Kubernetes Service objects that match a specified label selector. Upon finding a match, it automatically instructs Prometheus to scrape the metrics from all endpoint pods backing that service.
Consider a microservice with the following Service manifest:
apiVersion: v1
kind: Service
metadata:
  name: my-app-service
  namespace: production
  labels:
    app.kubernetes.io/name: my-app
    # This label is the key for discovery
    release: prometheus
spec:
  selector:
    app.kubernetes.io/name: my-app
  ports:
  - name: web # Must match the port name in the ServiceMonitor endpoint
    port: 8080
    targetPort: http
To enable Prometheus to scrape this service, create a ServiceMonitor that targets the release: prometheus label.
apiVersion: monitoring.coreos.com/v1
kind: ServiceMonitor
metadata:
  name: my-app-monitor
  namespace: production # Must be in the same namespace as the Prometheus instance or use namespaceSelector
  labels:
    # This label connects the monitor to your Prometheus instance
    release: prometheus
spec:
  selector:
    matchLabels:
      # This selects the Service based on its labels
      release: prometheus
  endpoints:
  - port: web # Must match the 'name' of the port in the Service spec
    # Scrape metrics every 30 seconds
    interval: 30s
    # Scrape from the /metrics path
    path: /metrics
Once this manifest is applied, the Prometheus Operator detects it, finds the matching my-app-service, and dynamically generates the required scrape configuration in the Prometheus configmap. No manual reloads are necessary.
Scraping Infrastructure with PodMonitor
While ServiceMonitor is ideal for applications fronted by a Kubernetes Service, it doesn't fit all use cases. Infrastructure components like node-exporter, which typically run as a DaemonSet to expose OS-level metrics from every cluster node, are not usually placed behind a load-balanced service.
This is the exact use case for PodMonitor. It bypasses the service layer and discovers pods directly based on their labels.
Here is a practical PodMonitor manifest for scraping node-exporter:
apiVersion: monitoring.coreos.com/v1
kind: PodMonitor
metadata:
  name: kube-prometheus-stack-node-exporter
  namespace: monitoring
  labels:
    release: prometheus
spec:
  selector:
    matchLabels:
      # Selects the node-exporter pods directly
      app.kubernetes.io/name: node-exporter
  podMetricsEndpoints:
  - port: metrics
    interval: 30s
Key Takeaway: Use
ServiceMonitorfor application workloads exposed via aServiceandPodMonitorfor infrastructure components like DaemonSets or stateful jobs where direct pod scraping is required. This separation ensures your monitoring configuration is clean and intentional.
Enriching Metrics with Relabeling
Ingesting metrics is insufficient; they must be enriched with context to be useful. Prometheus's relabeling mechanism is a powerful feature for dynamically adding, removing, or rewriting labels on metrics before they are ingested. This allows you to tag application metrics with critical Kubernetes metadata, such as pod name, namespace, or the node it's scheduled on.
The Prometheus Operator exposes relabelings and metricRelabelings fields in its monitor CRDs.
relabelings: Actions performed before the scrape, modifying labels on the target itself.metricRelabelings: Actions performed after the scrape but before ingestion, modifying labels on the metrics themselves.
For example, a metricRelabeling rule can be used to drop a high-cardinality metric that is causing storage pressure, thereby optimizing Prometheus performance.
metricRelabelings:
- sourceLabels: [__name__]
  regex: http_requests_total_by_path_user # A metric with user ID in a label
  action: drop
This rule instructs Prometheus to discard any metric with a matching name, preventing a potentially expensive metric from being stored in the time-series database. Mastering relabeling is a critical skill for operating an efficient Prometheus installation at scale.
Turning Metrics Into Actionable Alerts and Visuals
Collecting vast quantities of metrics is useless without mechanisms for interpretation and action. The goal is to create a feedback loop that transforms raw data from your Prometheus and Kubernetes environment into operational value through alerting and visualization.
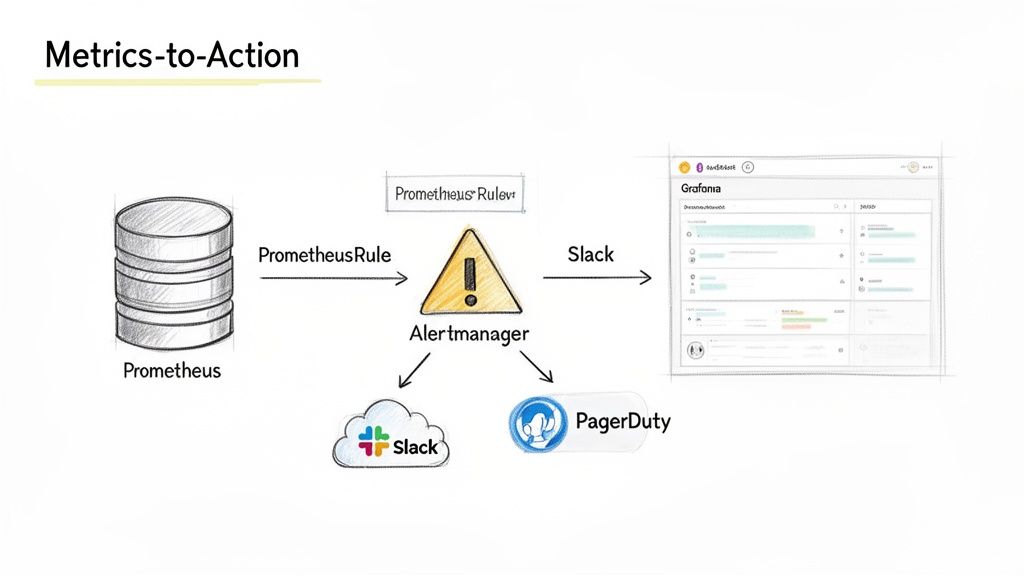
This process relies on two key components: Alertmanager handles the logic for deduplicating, grouping, and routing alerts, while Grafana provides the visual context required for engineers to rapidly diagnose the root cause of those alerts.
Configuring Alerts with PrometheusRule
In a Prometheus Operator-based setup, alerting logic is defined declaratively using the PrometheusRule CRD. This allows you to manage alerts as version-controlled Kubernetes objects, aligning with GitOps best practices.
A PrometheusRule manifest defines one or more rule groups. Here is an example of a critical alert designed to detect a pod in a CrashLoopBackOff state—a common and urgent issue in Kubernetes.
apiVersion: monitoring.coreos.com/v1
kind: PrometheusRule
metadata:
  name: critical-pod-alerts
  namespace: monitoring
  labels:
    release: prometheus # Ensures the Operator discovers this rule
spec:
  groups:
  - name: kubernetes-pod-alerts
    rules:
    - alert: KubePodCrashLooping
      expr: rate(kube_pod_container_status_restarts_total{job="kube-state-metrics"}[5m]) * 60 * 5 > 0
      for: 15m
      labels:
        severity: critical
      annotations:
        summary: "Pod {{ $labels.pod }} is crash looping"
        description: "Pod {{ $labels.pod }} in namespace {{ $labels.namespace }} has been restarting frequently for the last 15 minutes."
This rule uses the
kube_pod_container_status_restarts_totalmetric exposed bykube-state-metrics. The expression calculates the per-second restart rate over a 5-minute window and triggers a critical alert only if this condition persists for 15 minutes. Theforclause is crucial for preventing alert fatigue from transient, self-recovering issues.
Routing Notifications with Alertmanager
When an alert's condition is met, Prometheus forwards it to Alertmanager. Alertmanager then uses a configurable routing tree to determine the notification destination. This allows for sophisticated routing logic, such as sending high-severity alerts to PagerDuty while routing lower-priority warnings to a Slack channel.
The Alertmanager configuration is typically managed via a Kubernetes Secret. Here is a sample configuration:
global:
  resolve_timeout: 5m
  slack_api_url: '<YOUR_SLACK_WEBHOOK_URL>'

route:
  group_by: ['alertname', 'namespace']
  group_wait: 30s
  group_interval: 5m
  repeat_interval: 1h
  receiver: 'default-slack'
  routes:
  - match_re:
      severity: critical|high
    receiver: 'on-call-pagerduty'

receivers:
- name: 'default-slack'
  slack_configs:
  - channel: '#alerts-general'
    send_resolved: true
- name: 'on-call-pagerduty'
  pagerduty_configs:
  - service_key: '<YOUR_PAGERDUTY_INTEGRATION_KEY>'
This configuration defines two receivers. All alerts are routed to the #alerts-general Slack channel by default. However, if an alert contains a label severity matching critical or high, it is routed directly to PagerDuty, ensuring immediate notification for the on-call team.
Visualizing Data with Grafana
Alerts indicate when something is wrong; dashboards explain why. Grafana is the industry standard for visualizing Prometheus data. The kube-prometheus-stack chart deploys Grafana with Prometheus pre-configured as a data source, enabling immediate use.
A common first step is to import a community dashboard from the Grafana marketplace. For example, dashboard ID 15757 provides a comprehensive overview of Kubernetes pod resources.
For deeper insights, create custom panels to track application-specific SLOs. To visualize the 95th percentile (p95) API latency, you would use a PromQL (Prometheus Query Language) query like this:
histogram_quantile(0.95, sum(rate(http_request_duration_seconds_bucket[5m])) by (le, job))
This query calculates the p95 latency from a Prometheus histogram metric, providing a far more accurate representation of user experience than a simple average. To master such queries, explore the Prometheus Query Language in our detailed article. Building targeted visualizations is how you transform raw metrics into deep operational understanding.
Scaling Prometheus for Enterprise Workloads
A single Prometheus instance, while powerful, has inherent limitations in memory, disk I/O, and query performance. To monitor a large-scale, enterprise-grade infrastructure, you must adopt an architecture designed for high availability (HA), long-term data storage, and a global query view across all clusters.
This is where the Prometheus and Kubernetes ecosystem truly shines. Instead of scaling vertically by provisioning a massive server, we scale horizontally using a distributed architecture. Solutions like Thanos and Grafana Mimir build upon Prometheus, transforming it from a single-node tool into a globally scalable, highly available telemetry platform.
From Federation to Global Query Layers
An early scaling strategy was Prometheus Federation, where a central Prometheus server scrapes aggregated time series from leaf instances in each cluster. While simple, this approach has significant drawbacks, as the central server only receives a subset of the data, precluding deep, high-granularity analysis.
Modern architectures have evolved to use tools like Thanos and Grafana Mimir, which provide a true global query view without sacrificing metric fidelity.
The architectural principle is to let local Prometheus instances handle in-cluster scraping, their core competency. A separate, horizontally scalable layer is then added to manage global querying, long-term storage, and high availability. This decoupled model is inherently more robust and scalable.
These systems solve three critical challenges at scale:
- High Availability (HA): By running redundant, stateless components, they eliminate single points of failure, ensuring the monitoring system remains operational even if a Prometheus server fails.
- Long-Term Storage (LTS): They offload historical metrics to cost-effective and durable object storage like Amazon S3 or Google Cloud Storage, decoupling retention from local disk capacity.
- Global Query View: They provide a single query endpoint that intelligently fetches data from all cluster-local Prometheus instances and long-term storage, presenting a seamless, unified view of the entire infrastructure.
Comparing Thanos and Mimir Architectures
While Thanos and Mimir share similar goals, their underlying architectures differ. Understanding these differences is key to selecting the appropriate tool.
Thanos typically employs a sidecar model. A Thanos Sidecar container is deployed within each Prometheus pod. This sidecar has two primary functions: it uploads newly written TSDB blocks to object storage and exposes a gRPC Store API that allows a central Thanos Query component to access recent data directly from the Prometheus instance.
Grafana Mimir, conversely, primarily uses a remote-write model (inherited from its predecessor, Cortex). In this architecture, each Prometheus instance is configured to actively push its metrics to a central Mimir distributor via the remote_write API. This decouples the Prometheus scrapers from the central storage system completely.
| Architectural Model | Thanos (Sidecar) | Grafana Mimir (Remote-Write) |
|---|---|---|
| Data Flow | Pull-based. Thanos Query fetches data from sidecars and object storage. |
Push-based. Prometheus pushes metrics to the Mimir distributor. |
| Deployment | Requires adding a sidecar container to each Prometheus pod. | Requires configuring the remote_write setting in Prometheus. |
| Coupling | Tightly coupled. The sidecar's lifecycle is tied to the Prometheus instance. | Loosely coupled. Prometheus and Mimir operate as independent services. |
| Use Case | Excellent for augmenting existing Prometheus deployments with minimal disruption. | Ideal for building a centralized, multi-tenant monitoring-as-a-service platform. |
As organizations scale, so does workload complexity. The convergence of Kubernetes and AI is reshaping application deployment, making monitoring even more critical. Prometheus is essential for tracking AI-specific metrics like model inference latency, GPU utilization, and prediction accuracy. For more on this trend, explore these insights on Kubernetes and AI orchestration.
Common Questions About Prometheus and Kubernetes
Deploying a new monitoring stack invariably raises practical questions. As you integrate Prometheus into your Kubernetes clusters, you will encounter common challenges and architectural decisions. This section provides technical answers to frequently asked questions.
Getting these details right transforms a monitoring system from a maintenance burden into a robust, reliable observability platform.
How Do I Secure Prometheus and Grafana in Production?
Securing your monitoring stack is a day-one priority. A defense-in-depth strategy is essential for protecting sensitive operational data.
For Prometheus, implement network-level controls using Kubernetes NetworkPolicies. Define ingress rules that restrict access to the Prometheus API and UI, allowing connections only from trusted sources like Grafana and Alertmanager. This prevents unauthorized access from other pods within the cluster.
For Grafana, immediately replace the default admin:admin credentials. Configure a robust authentication method like OAuth2/OIDC integrated with your organization's identity provider (e.g., Google, Okta, Azure AD). This enforces single sign-on (SSO) and centralizes user management.
Beyond authentication, implement Role-Based Access Control (RBAC). Both the Prometheus Operator and Grafana support fine-grained permissions. Configure Grafana roles to grant teams read-only access to specific dashboards while restricting administrative privileges to SREs or platform engineers.
Finally, manage all secrets—such as Alertmanager credentials for Slack webhooks or PagerDuty keys—using Kubernetes Secrets. Mount these secrets into pods as environment variables or files; never hardcode them in manifests or container images. Always expose UIs through an Ingress controller configured with TLS termination.
What Are the Best Practices for Managing Resource Consumption?
Unconstrained, Prometheus can consume significant CPU, memory, and disk resources. Proactive resource management is critical for maintaining performance and stability.
First, manage storage. Configure a sensible retention period using the --storage.tsdb.retention.time flag. A retention of 15 to 30 days is a common starting point for local storage. For longer-term data retention, implement a solution like Thanos or Grafana Mimir.
Second, control metric cardinality. Use metric_relabel_configs to drop high-cardinality metrics that provide low operational value. High-cardinality labels (e.g., user IDs, request UUIDs) are a primary cause of memory pressure. Additionally, adjust scrape intervals; less critical targets may not require a 15-second scrape frequency and can be set to 60 seconds or longer to reduce load.
Finally, define resource requests and limits for your Prometheus pods. Leaving these unset makes the pod a candidate for OOMKilled events or resource starvation. Start with a baseline (e.g., 2 CPU cores, 4Gi memory) and use the Vertical Pod Autoscaler (VPA) in recommendation mode to determine optimal values based on actual usage patterns in your environment.
How Can I Monitor Applications Without Native Prometheus Metrics?
To monitor applications that do not natively expose a /metrics endpoint (e.g., legacy services, third-party databases), you must use an exporter.
An exporter is a specialized proxy that translates metrics from a non-Prometheus format into the Prometheus exposition format. It queries the target application using its native protocol (e.g., SQL, JMX, Redis protocol) and exposes the translated metrics on an HTTP endpoint for Prometheus to scrape.
A vast ecosystem of open-source exporters exists for common applications:
postgres_exporterfor PostgreSQL databases.jmx_exporterfor Java applications exposing metrics via JMX.redis_exporterfor Redis instances.
The recommended deployment pattern is to run the exporter as a sidecar container within the same pod as the application. This simplifies network communication (typically over localhost) and couples the lifecycle of the exporter to the application. A PodMonitor can then be used to discover and scrape the exporter's metrics endpoint.
What Is the Difference Between a ServiceMonitor and a PodMonitor?
ServiceMonitor and PodMonitor are the core CRDs that enable the Prometheus Operator's automated service discovery, but they target resources differently.
A ServiceMonitor is the standard choice for monitoring applications deployed within your cluster. It discovers targets by selecting Kubernetes Service objects based on labels. Prometheus then scrapes the endpoints of all pods backing the selected services. This is the idiomatic way to monitor microservices.
A PodMonitor, in contrast, bypasses the Service abstraction and discovers Pod objects directly via a label selector. This is necessary for scraping targets that are not fronted by a stable service IP, such as individual members of a StatefulSet or pods in a DaemonSet like node-exporter. A PodMonitor is required when you need to target each pod instance individually.
Navigating the complexities of DevOps can be a major challenge. OpsMoon connects you with the top 0.7% of remote DevOps engineers to help you build, scale, and manage your infrastructure with confidence. Start with a free work planning session to map out your goals and see how our experts can accelerate your software delivery. Learn more about our flexible DevOps services at OpsMoon.