Your Guide to DevOps Implementation Services
 By opsmoon
A practical guide to DevOps implementation services. Learn to build a CI/CD pipeline, use IaC, and integrate security for a successful DevOps transformation.
DevOps implementation services provide the technical expertise and strategic guidance to automate your software delivery lifecycle, transforming how code moves from a developer's machine into a production environment. The objective is to dismantle silos between development and operations, engineer robust CI/CD pipelines, and select the optimal toolchain to accelerate release velocity and enhance system reliability.
Your Technical Roadmap for DevOps Implementation
Executing a DevOps transformation is a deep, technical re-engineering of how you build, test, and deploy software. Without a precise, technical plan, you risk a chaotic implementation with incompatible tools, brittle pipelines, and frustrated engineering teams.
This guide provides a direct, no-fluff roadmap for what to expect and how to execute when you engage with a DevOps implementation partner. We will bypass high-level theory to focus on the specific technical actions your engineering teams must take to build lasting, high-performance practices. The methodology is a structured path: assess, architect, and automate.
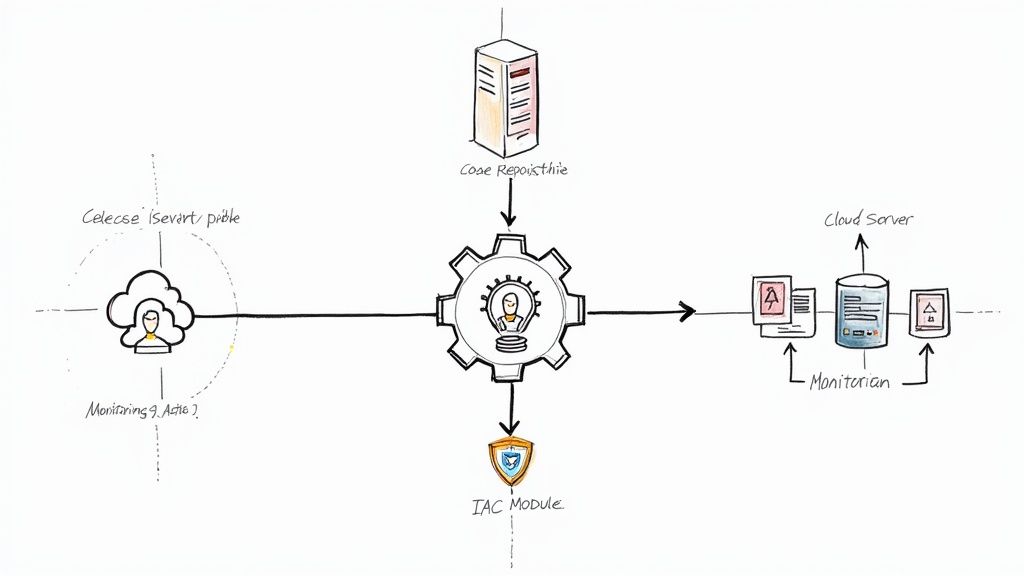
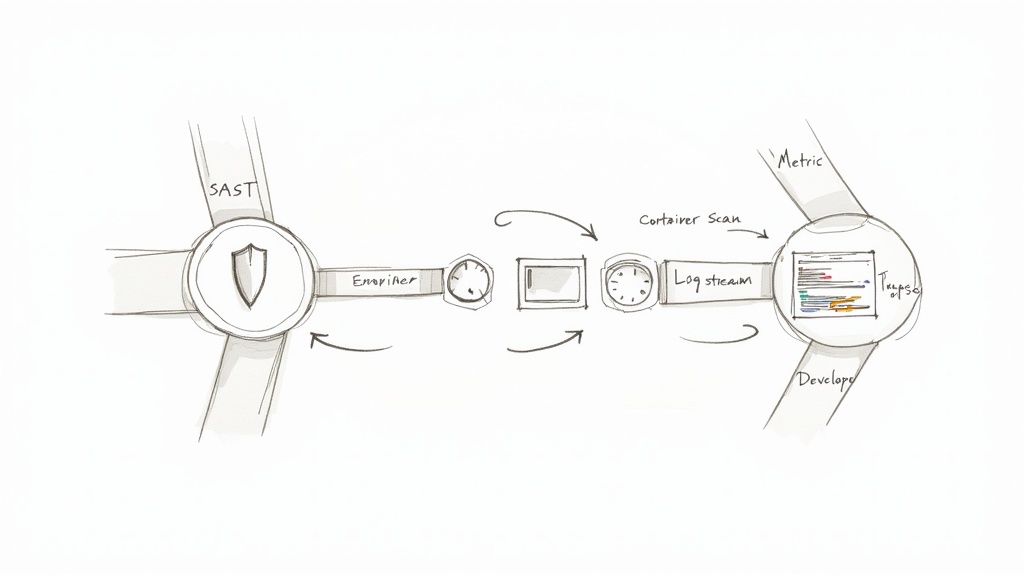
This infographic lays out the typical high-level flow.
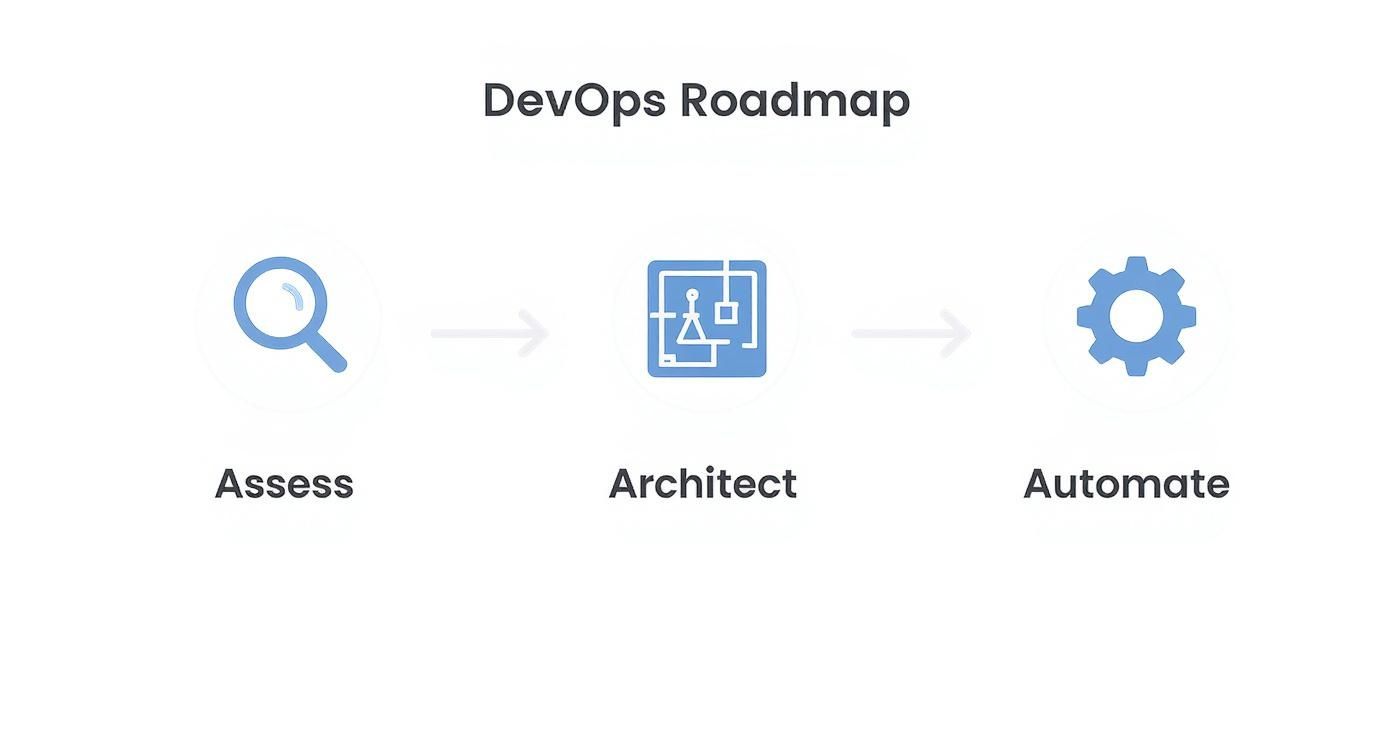
As you can see, a solid implementation always starts with a deep dive into where you are right now. Only then can you design the future state and start automating the workflows to get there.
Navigating the Modern Delivery Landscape
The push for this kind of technical transformation is massive. The global DevOps market hit about $13.16 billion in 2024 and is expected to climb to $15.06 billion by 2025. This isn't just hype; businesses need to deliver features faster and more reliably to stay in the game.
The data backs it up, with a staggering 99% of adopters saying DevOps has had a positive impact on their work. You can find more real-world stats on the state of DevOps at Baytech Consulting. A well-planned DevOps strategy, often kickstarted by expert services, provides the technical backbone to make it happen.
A successful DevOps transformation isn't about collecting a bunch of shiny new tools. It’s about building a cohesive, automated system where every part—from version control to monitoring—works together to deliver real value to your users, efficiently and predictably.
Before jumping into a full-scale implementation, it's crucial to understand your current capabilities. The following framework can help you pinpoint where you stand across different domains, giving you a clear starting line for your DevOps journey.
DevOps Maturity Assessment Framework
| Domain | Level 1 (Initial) | Level 2 (Managed) | Level 3 (Defined) | Level 4 (Optimizing) |
|---|---|---|---|---|
| Culture & Collaboration | Siloed teams, manual handoffs. | Some cross-team communication. | Shared goals, defined processes. | Proactive collaboration, blameless culture. |
| CI/CD Automation | Manual builds and deployments. | Basic build automation in place. | Fully automated CI/CD pipelines. | Self-service pipelines, continuous deployment. |
| Infrastructure | Manually managed servers. | Some configuration management. | Infrastructure as Code (IaC) is standard. | Immutable infrastructure, fully automated provisioning. |
| Monitoring & Feedback | Basic server monitoring, reactive alerts. | Centralized logging and metrics. | Proactive monitoring, application performance monitoring. | Predictive analytics, automated remediation. |
| Security | Security is a final, separate step. | Some automated security scanning. | Security integrated into the pipeline (DevSecOps). | Continuous security monitoring and policy as code. |
Using a framework like this gives you a data-driven way to prioritize your efforts and measure progress, ensuring your implementation focuses on the areas that will deliver the most impact.
Key Focus Areas in Your Implementation
As we move through this guide, we'll focus on the core technical pillars that are absolutely essential for a strong DevOps practice. This is where professional services can really move the needle for your organization.
- Maturity Assessment: First, you have to know your starting point. This means a real, honest look at your current workflows, toolchains, and cultural readiness. No sugarcoating.
- CI/CD Pipeline Architecture: This is the assembly line for your software. We’re talking about designing a repeatable, version-controlled pipeline using tools like Jenkins, GitLab CI, or GitHub Actions.
- Infrastructure as Code (IaC): Say goodbye to configuration drift. Automating your environment provisioning with tools like Terraform or Pulumi is non-negotiable for consistency and scale.
- Automated Testing Integration: Quality can't be an afterthought. This means embedding unit, integration, and security tests right into the pipeline to catch issues early and often.
- Observability and Monitoring: To move fast, you need to see what's happening. This involves setting up robust logging, metrics, and tracing to create tight, actionable feedback loops.
Each of these pillars is a critical step toward building a high-performing engineering organization that can deliver software quickly and reliably.
Laying the Foundation with Assessment and Planning
Before you automate a single line of code or swipe the company card on a shiny new tool, stop. A real DevOps transformation doesn't start with action; it starts with an honest, unflinching look in the mirror. Jumping straight into implementation without a clear map of where you are is the fastest way to burn cash, frustrate your teams, and end up right back where you started.
The first move is always to establish a data-driven baseline. You need to expose every single point of friction in your software development lifecycle (SDLC), from a developer's first commit all the way to production.
A crucial part of this is a thorough business technology assessment. This isn't just about listing your servers; it's a diagnostic audit to uncover the root causes of slow delivery and instability. Think of it as creating a detailed value stream map that shows every step, every handoff, and every delay.
This means getting your hands dirty with a technical deep-dive into your current systems and workflows. You have to objectively analyze what you're actually doing today, not what you think you're doing. Only then can you build a strategic plan that solves real problems.
Your Technical Audit Checklist
To get that clear picture, you need to go granular. This isn't a high-level PowerPoint review; it's a nuts-and-bolts inspection of how your delivery machine actually works. Use this checklist to kick off your investigation:
- Source Code Management: How are repos structured? Is there a consistent branching strategy like GitFlow or Trunk-Based Development, or is it the Wild West? How are permissions managed?
- Build Process: Is the build automated, or does it depend on someone's laptop? How long does a typical build take, and what are the usual suspects when it fails?
- Testing Automation: What's your real test automation coverage (unit, integration, E2E)? Do tests run automatically on every single commit, or is it a manual affair? And more importantly, how reliable are the results?
- Environment Provisioning: How do you spin up dev, staging, and production environments? Are they identical, or are you constantly battling configuration drift and the dreaded "it works on my machine" syndrome?
- Deployment Mechanism: Are deployments a manual, high-stress event, or are they scripted and automated? What's the rollback plan, and how long does it take to execute when things go south?
- Monitoring and Logging: Do you have centralized logging and metrics that give you instant insight, or is every production issue a multi-hour detective story?
Answering these questions honestly will shine a bright light on your biggest bottlenecks—things like manual QA handoffs, flaky staging environments, or tangled release processes that are actively killing your speed. For a more structured approach, check out our guide on how to conduct a DevOps maturity assessment.
From Assessment to Actionable Roadmap
Once you know exactly what’s broken, you can build a roadmap to fix it. This isn't a shopping list of tools. It's a prioritized plan that ties every technical initiative directly to a business outcome. A good roadmap makes it clear how geeky goals create measurable business value.
For example, don't just say, "We will automate deployments." Instead, aim for something like, "We will slash deployment lead time from 2 weeks to under 24 hours by implementing a blue/green deployment strategy, reducing the Change Failure Rate by 50%." That’s a specific, measurable target that leadership can actually get behind.
A classic mistake is trying to boil the ocean. A winning roadmap prioritizes initiatives by impact versus effort. Find the low-effort, high-impact wins—like automating the build process—and tackle those first to build momentum.
Your roadmap absolutely must define the Key Performance Indicators (KPIs) you'll use to measure success. Focus on the metrics that truly matter:
- Deployment Lead Time: The clock starts at the code commit and stops when it's live in production. How long does that take?
- Deployment Frequency: How often are you pushing changes to production? Daily? Weekly? Monthly?
- Change Failure Rate: What percentage of your deployments cause a production failure? The elite performers aim for a rate under 15%.
- Mean Time to Recovery (MTTR): When an outage hits, how fast can you restore service?
Finally, you have to get buy-in. Show the business how these technical improvements directly impact the bottom line. Reducing MTTR isn't just a tech achievement; it's about minimizing revenue loss during a crisis. This alignment is what gets you the budget and support to turn your plan into reality.
Building and Automating Your CI/CD Pipeline
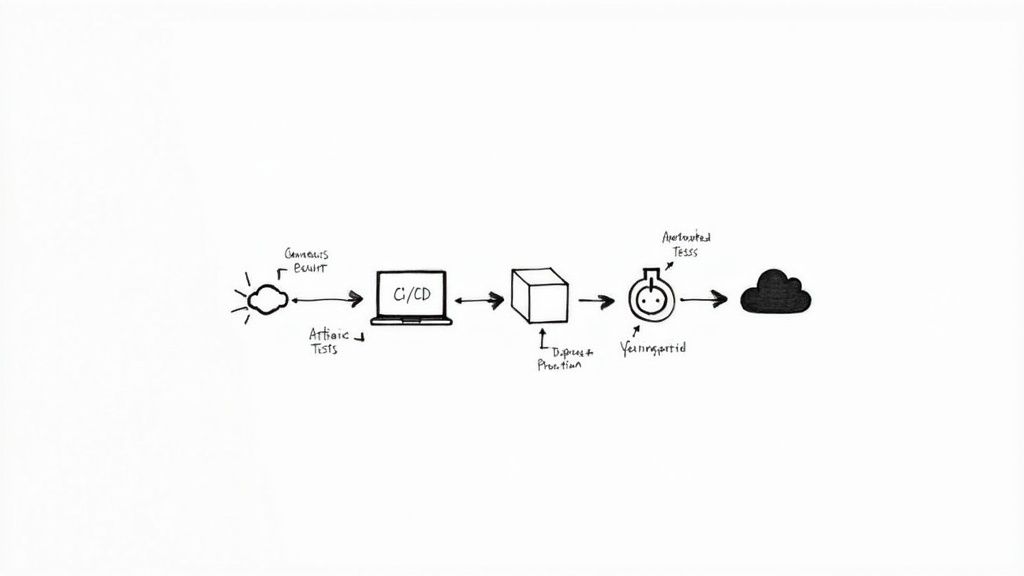
Think of the Continuous Integration and Continuous Deployment (CI/CD) pipeline as the engine driving your entire DevOps practice. It's the automated highway that takes code from a developer's commit all the way through building, testing, and deployment—all without anyone needing to lift a finger. A clunky pipeline becomes a bottleneck, but a well-designed one is your ticket to shipping software faster.
This automation isn't just about flipping a switch; it's about methodically designing a workflow that’s reliable, scalable, and secure. This is the nuts and bolts of what a DevOps implementation service provider actually builds.
Selecting Your Pipeline Orchestrator
Your first big decision is picking a CI/CD orchestrator. This tool is the brain of your pipeline—it triggers jobs, runs scripts, and manages the whole flow. Honestly, the best choice usually comes down to your existing tech stack.
- GitLab CI/CD: If your code already lives in GitLab, this is a no-brainer. The
.gitlab-ci.ymlfile sits right in your repository, so the pipeline configuration is version-controlled from day one. - GitHub Actions: For teams on GitHub, Actions is a seriously powerful, event-driven framework. The marketplace is full of pre-built actions that can save you a ton of time setting up common pipeline tasks.
- Jenkins: As the open-source veteran, Jenkins offers incredible flexibility with its massive plugin ecosystem. But that freedom comes at a price: more hands-on work for setup, configuration, and keeping it secure.
The main goal is to pick something that integrates smoothly with your version control system. You want to reduce friction for your dev teams, not add more.
Architecting the Core Pipeline Stages
A solid CI/CD pipeline is built from a series of distinct, automated stages. Each one acts as a quality gate. If a job fails at any point, the whole process stops, and the team gets immediate feedback. This is how you stop bad code in its tracks.
This level of automation is why, by 2025, an estimated 50% of DevOps adopters are expected to be recognized as elite or high-performing organizations. It's a direct response to the need for faster delivery and better software quality.
The core idea here is to "shift left"—catch errors as early as possible. A bug found during the CI stage is exponentially cheaper and faster to fix than one a customer finds in production.
At a minimum, your pipeline should include these stages:
- Commit Stage: This kicks off automatically with a
git push. Solid version control best practices are non-negotiable; they're the foundation of team collaboration and code integrity. - Build Stage: The pipeline grabs the code and compiles it into an executable artifact, like a Docker image or a JAR file.
- Test Stage: Here's where you unleash your automated test suites. This should cover static code analysis (linting), unit tests, and integration tests to make sure new changes work and don't break anything.
- Artifact Storage: Once the build and tests pass, the artifact gets versioned and pushed to a central repository like JFrog Artrifactory or Sonatype Nexus. This gives you a single, unchangeable source of truth for every build.
- Deploy Stage: The versioned artifact is then deployed to a staging environment for more testing (like UAT or performance checks) before it ever gets promoted to production.
If you want to really dial in your workflow, check out our deep dive into CI/CD pipeline best practices.
From Scripts to Pipeline-as-Code
When you're starting out, it’s tempting to click around a web UI to configure your pipeline jobs. Don't do it. That approach is brittle and just doesn't scale. The modern standard is Pipeline-as-Code.
With this approach, the entire pipeline definition is stored in a declarative file (usually YAML) right inside the project's repository.
Here’s a quick look at a simple GitHub Actions workflow for a Node.js app:
name: Node.js CI

on:
  push:
    branches: [ "main" ]
  pull_request:
    branches: [ "main" ]

jobs:
  build:
    runs-on: ubuntu-latest

    strategy:
      matrix:
        node-version: [18.x, 20.x]

    steps:
    - uses: actions/checkout@v4
    - name: Use Node.js ${{ matrix.node-version }}
      uses: actions/setup-node@v4
      with:
        node-version: ${{ matrix.node-version }}
        cache: 'npm'
    - run: npm ci
    - run: npm run build --if-present
    - run: npm test
Treating your pipeline as code makes it version-controlled, repeatable, and easy to review—just like the application code it builds.
Securing Your Deployment Process
Finally, automation without security is a recipe for disaster. Hardcoding secrets like API keys or database credentials directly into pipeline scripts is a massive security hole. You need to use a dedicated secrets management tool.
- HashiCorp Vault: This gives you a central place for managing secrets, handling encryption, and controlling access. Your pipeline authenticates with Vault to fetch credentials on the fly at runtime.
- Cloud-Native Solutions: Tools like AWS Secrets Manager or Azure Key Vault are great options if you're already embedded in their cloud ecosystems, as they integrate seamlessly.
By pulling secrets from a secure vault, you guarantee that sensitive information is never exposed in logs or source code. This creates a secure, auditable deployment process that’s absolutely essential for any professional DevOps setup.
Weaving Code into Your Infrastructure and Configuration
Let's talk about one of the biggest sources of headaches in any growing tech company: manual environment provisioning. It's the root cause of that dreaded phrase, "well, it worked on my machine," scaled up to wreak havoc across your entire delivery process. Inconsistencies between dev, staging, and prod environments lead to failed deployments, phantom bugs, and a whole lot of wasted time.
This is where we draw a line in the sand. To get this chaos under control, we lean heavily on two practices that are the absolute bedrock of modern, scalable infrastructure: Infrastructure as Code (IaC) and configuration management.
The idea is simple but powerful: treat your infrastructure—servers, networks, databases, load balancers, the whole lot—just like you treat your application code. You define everything in human-readable files, check them into version control (like Git), and let automation handle the rest. This creates a single, reliable source of truth for every environment. The result? Infrastructure that's repeatable, predictable, and ready to scale on demand.
Laying the Foundation: Provisioning Cloud Resources with IaC
The first step is actually creating the raw infrastructure. This is where declarative IaC tools really come into their own. Instead of writing a script that says how to create a server, you write a definition of the desired state—what you want the final environment to look like. The tool then intelligently figures out the steps to get there.
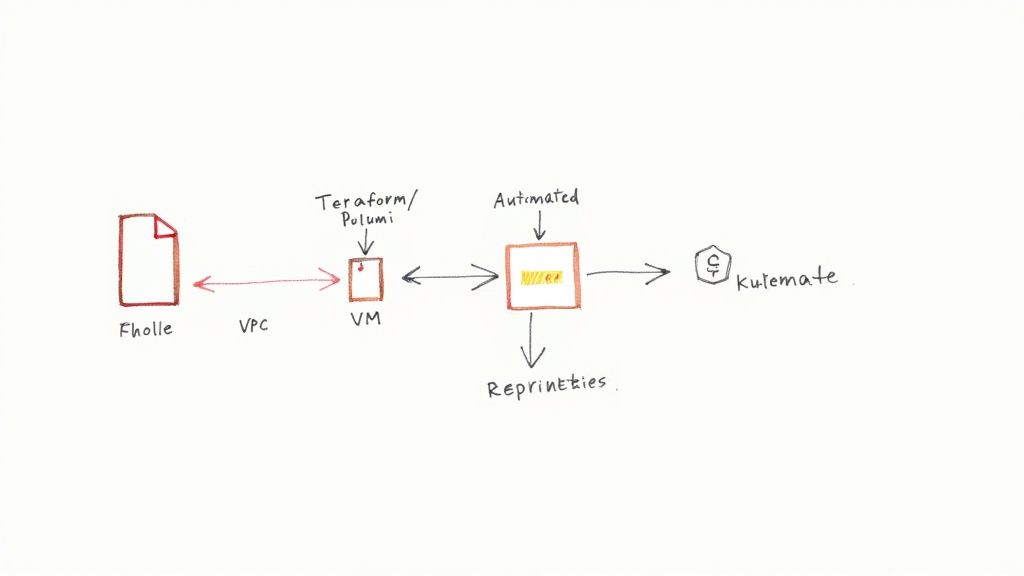
The two heavyweights in this space are Terraform and Pulumi.
- Terraform: Uses its own simple, declarative language (HCL) that's incredibly easy for ops folks to pick up. Its real power lies in its massive ecosystem of "providers," which offer support for virtually every cloud service you can think of.
- Pulumi: Takes a different approach, letting you define infrastructure using the same programming languages your developers already know, like Python, Go, or TypeScript. This is a game-changer for dev teams, allowing them to use familiar logic and tooling to build out infrastructure.
Whichever tool you choose, the state file is your most critical asset. Think of it as the tool's memory, mapping your code definitions to the actual resources running in the cloud. If you don't manage this file properly, you're opening the door to "configuration drift," where manual changes made in the cloud console cause reality to diverge from your code. Using a centralized, remote backend for your state (like an S3 bucket with locking enabled) isn't optional for teams; it's essential.
Your IaC code must be the only way infrastructure is ever changed. Period. Lock this down with strict IAM policies that prevent anyone from making manual edits to production resources in the cloud console. This discipline is what separates a reliable system from a ticking time bomb.
Getting the Details Right: Consistent System Configuration
Once your virtual machines, Kubernetes clusters, and networks are up and running, they still need to be configured. This means installing software, setting up user accounts, managing services, and applying security patches. This is the job of configuration management tools like Ansible, Puppet, or Chef.
These tools guarantee that every server in a group has the exact same configuration, right down to the last file permission.
- Ansible: Is beautifully simple. It's agentless, operating over standard SSH, and uses easy-to-read YAML files called "playbooks." Its step-by-step, procedural nature makes it perfect for orchestration tasks.
- Puppet & Chef: These tools are agent-based and take a more model-driven, declarative approach. They excel at enforcing a consistent state across a massive fleet of servers over the long term.
For example, you could write a single Ansible playbook to install and configure an Nginx web server. That playbook ensures the same version, the same nginx.conf file, and the same firewall rules are applied to every single web server in your cluster. Store that playbook in Git, and you have a versioned, repeatable process for configuration.
Putting It All Together: IaC in Your CI/CD Pipeline
Here's where the magic really happens. When you wire these IaC and configuration tools directly into your CI/CD pipeline, you create a fully automated system for building, managing, and tearing down entire environments on demand.
A common workflow looks something like this:
- A developer creates a new Git branch for a feature they're working on.
- Your CI/CD platform (like GitLab CI or GitHub Actions) detects the new branch and kicks off a pipeline.
- A pipeline stage runs
terraform applyto spin up a completely new, isolated test environment just for that branch. - Once the infrastructure is live, another stage runs an Ansible playbook to configure the servers and deploy the new application code.
- The pipeline then executes a full battery of automated tests against this fresh, production-like environment.
- When the branch is merged, a final pipeline job automatically runs
terraform destroyto tear the whole environment down, ensuring you're not paying for idle resources.
This integration empowers developers with ephemeral, production-mirroring environments for every single change. It dramatically improves the quality of testing and all but eliminates the risk of "it broke in prod" surprises.
To get a better handle on the nuances, we've put together a comprehensive guide on Infrastructure as Code best practices. By mastering IaC and configuration management, you're not just automating tasks; you're building a resilient, predictable, and scalable foundation for delivering great software, fast.
Comparison of Popular DevOps Automation Tools
Choosing the right tools can feel overwhelming. To help clarify the landscape, here's a breakdown of some of the leading tools across the key automation categories. Each has its strengths, and the best choice often depends on your team's existing skills and specific needs.
| Tool Category | Tool Example | Primary Use Case | Key Technical Feature |
|---|---|---|---|
| CI/CD | GitLab CI/CD | All-in-one platform for source code management, CI, and CD. | Tightly integrated .gitlab-ci.yml pipeline configuration within the same repo as the application code. |
| CI/CD | GitHub Actions | Flexible CI/CD and workflow automation built into GitHub. | Massive marketplace of pre-built actions, making it easy to integrate with almost any service. |
| CI/CD | Jenkins | Highly extensible, open-source automation server. | Unmatched flexibility through a vast plugin ecosystem; can be configured to do almost anything. |
| Infrastructure as Code (IaC) | Terraform | Provisioning and managing cloud and on-prem infrastructure. | Declarative HCL syntax and a provider-based architecture that supports hundreds of services. |
| Infrastructure as Code (IaC) | Pulumi | Defining infrastructure using general-purpose programming languages. | Enables use of loops, functions, and classes from languages like Python, TypeScript, and Go to build infrastructure. |
| Configuration Management | Ansible | Application deployment, configuration management, and orchestration. | Agentless architecture using SSH and simple, human-readable YAML playbooks. |
| Monitoring | Prometheus | Open-source systems monitoring and alerting toolkit. | A time-series database and powerful query language (PromQL) designed for reliability and scalability. |
| Monitoring | Datadog | SaaS-based monitoring, security, and analytics platform. | Unified platform that brings together metrics, traces, and logs from over 700 integrations. |
Ultimately, the goal is to select a stack that works seamlessly together. A common and powerful combination is using Terraform for provisioning, Ansible for configuration, and GitLab CI for orchestrating the entire workflow from commit to deployment, all while being monitored by Prometheus.
A fast, automated pipeline is a massive advantage. But if that pipeline is shipping insecure code or failing without anyone noticing, it quickly becomes a liability. Getting DevOps right means going beyond just speed; it's about embedding security and reliability into every single step of the process.
This is where the conversation shifts from DevOps to DevSecOps and embraces the idea of full-stack observability.
We need to stop thinking of security as the final gatekeeper that slows everything down. Instead, it should be a continuous, automated check that runs right alongside every code commit. At the same time, we have to build a monitoring strategy that gives us deep, actionable insights—not just a simple "the server is up" alert.
Shift Security Left with Automated Tooling
The whole point of DevSecOps is to "shift security left." All this really means is finding and squashing vulnerabilities as early as humanly possible. Think about it: a bug found on a developer's machine is exponentially cheaper and faster to fix than one found in production by a bad actor.
So, how do we actually do this? By integrating automated security tools directly into the CI pipeline. This isn't about adding more manual review bottlenecks; it's about making security checks as normal and expected as running unit tests.
Here are the essential scans you should bake into your pipeline:
- Static Application Security Testing (SAST): These tools scan your source code for common security flaws, like SQL injection risks or other sketchy coding patterns. Tools like SonarQube or Snyk Code can be set up to run on every pull request, failing the build if anything critical pops up.
- Software Composition Analysis (SCA): Let's be honest, modern apps are built on mountains of open-source dependencies. SCA tools like GitHub's Dependabot or OWASP Dependency-Check scan these libraries for known vulnerabilities (CVEs), letting you know immediately when a package needs an update.
- Container Image Scanning: Before you even think about pushing a Docker image to your registry, it needs to be scanned. Tools like Trivy or Clair inspect every single layer of your container, flagging vulnerabilities in the base OS and any packages you've installed.
Build a Full Observability Stack
Old-school monitoring usually stops at system-level metrics like CPU and memory. That’s useful, but it tells you next to nothing about what your users are actually experiencing. Observability digs much deeper, giving you the context to understand why a system is acting up.
A solid observability stack is built on three pillars: metrics, logs, and traces.
A common trap is collecting tons of data with no clear purpose. The goal isn't to hoard terabytes of logs. It's to create a tight, actionable feedback loop so your engineers can diagnose and fix issues fast.
You can build a powerful, open-source stack to get there:
- Prometheus: This is your go-to for collecting time-series metrics. You instrument your application to expose key performance indicators (think request latency or error rates), and Prometheus scrapes and stores them.
- Grafana: This is where you bring your Prometheus metrics to life by creating rich, visual dashboards. A well-designed dashboard in Grafana tells a story, connecting application performance to business results and system health.
- Loki: For pulling together logs from every application and piece of infrastructure you have. The real magic of Loki is its seamless integration with Grafana. You can spot a spike on a metric dashboard and jump to the exact logs from that moment with a single click.
- Jaeger: Essential for distributed tracing. In a microservices world, a single user request might bounce between dozens of services. Jaeger follows that request on its journey, helping you pinpoint exactly where a bottleneck or failure happened.
This kind of integrated setup helps you move from constantly fighting fires to proactively solving problems before they escalate. While the technical lift is real, the cultural hurdles can be even tougher. Research points to cultural resistance (45%) and a lack of skilled people (31%) as major roadblocks.
Focusing on security helps bridge that gap, especially when you consider the DevSecOps market is expected to hit $41.66 billion by 2030. You can find more DevOps statistics and insights on Spacelift. This just goes to show why having a partner with deep DevOps implementation expertise can be invaluable for navigating both the tech and the people-side of this transformation.
Common Questions About DevOps Implementation
Diving into a DevOps transformation always stirs up a ton of questions, both on the tech and strategy side. Getting straight, real-world answers is key to setting the right expectations and making sure your implementation partner is on the same page as you. Here are a few of the big questions we get asked all the time.
What Are the First Steps in a DevOps Implementation Project?
The first thing we do is a deep technical assessment. And I don't mean a high-level chat. We're talking about mapping your entire value stream—from the moment a developer commits code all the way to a production release—to find every single manual handoff, delay, and point of friction.
A good DevOps implementation service will dig into your source code management, your build automation (or lack thereof), your testing setups, and how you get code out the door. The result is a detailed report and a maturity score that shows you where you stand against the rest of the industry. It gives you a real, data-driven place to start from.
How Do You Measure the ROI of DevOps Implementation?
Measuring the ROI of DevOps isn't just about one thing; it's a mix of technical and business metrics. On the technical side, the gold standard is the four key DORA metrics. They give you a brutally honest look at your delivery performance.
- Deployment Frequency: How often are you pushing code to production?
- Lead Time for Changes: How long does it take for a commit to actually go live?
- Change Failure Rate: What percentage of your deployments blow up in production?
- Mean Time to Recovery (MTTR): When things do break, how fast can you fix them?
Then you've got the business side of things. Think about reduced operational costs because you've automated everything, getting new features to market faster, and happier customers because your app is more stable. A successful project will show clear, positive movement across all these numbers over time.
A classic mistake is getting obsessed with speed alone. The real ROI from DevOps is found in the sweet spot between speed and stability. Shipping faster is great, but it's the combo of shipping faster while reducing failures and recovery times that delivers true business value.
What Is the Difference Between DevOps and DevSecOps?
DevOps is all about tearing down the walls between development and operations teams to make the whole software delivery process smoother. It's really a cultural shift toward shared ownership and automation to get software out faster and more reliably.
DevSecOps is the next logical step. It's about baking security into every single part of the pipeline, right from the very beginning. Instead of security being this last-minute gatekeeper that everyone dreads, it becomes a shared responsibility for the entire team.
In the real world, this means automating security checks right inside your CI/CD pipeline. We're talking about things like:
- Static Application Security Testing (SAST) to scan your source code for bugs.
- Software Composition Analysis (SCA) to check for vulnerabilities in your open-source libraries.
- Container Vulnerability Scanning to analyze your Docker images before they ever get deployed.
The whole point is to "shift security left." You find and fix vulnerabilities early in the development cycle when they're way cheaper and easier to deal with. It's a proactive approach that lets you build safer software without slowing down.
Ready to accelerate your software delivery with expert guidance? At OpsMoon, we connect you with the top 0.7% of remote DevOps engineers to build and manage your CI/CD pipelines, infrastructure, and observability stacks. Start with a free work planning session to map your roadmap and find the perfect talent for your technical needs. Learn more at https://opsmoon.com.